


The halving of Bitcoin (BTC) and other crypto assets like Litecoin (LTC) is still a major catalyst, albeit with a lower performance of Litecoin (LTC) since the recent halving; There are growing concerns about a Bitcoin (BTC) halving event.
Litecoin saw its price drop after the halving as many pundits and analysts speculated on a weaker trend of the halving ahead of Bitcoin amid expectations of an imminent bull run.
The price of Bitcoin and other crypto assets like Ethereum (ETH), Binance Coin (BNB) and Ripple (XRP) have all had a rough week as bears tend to have an advantage over prices.
Ripple (XRP) price dominance has declined dramatically over the past few days following news that the court was successful as the price continues to suffer from a drop in price from its peak of $0.93 to $0.66, with the price likely to decrease further.
Statistics on Coin360 have shown a large influence of bears on the price of the major cryptocurrencies, with only a few exceptions, which are performing well at the start of a new week and on these top 5 altcoins (GALA, SHIB, MATIC, INJ, ADA) many opportunities appear on the horizon. .
Bitcoin (BTC) price remains under the influence of bears as the price struggles to regain an uptrend. As the bears try to take full advantage of BTC price, BTC price needs to regain the $30,000 level to have many upside chances.
If Bitcoin (BTC) price falls below $28,500, which is a strong interest for many long positions, bears could push BTC price to a low of $27,500.
On the daily (1D) timeframe, Bitcoin (BTC) price is trading below the 50-day Exponential Moving Average (EMA) with its daily Relative Strength Index (RSI) looking weak, suggesting a bearish scenario for BTC price, if prize fails to reclaim $30,000.
As BTC’s price looks bearish, Ethereum (ETH) also continues to look bearish as BTC’s dominance continues to hurt many altcoins.
Ethereum (ETH) price continues to hold above the key $1,820 support; If ETH price closes below this support level, the price could drop to a low of $1,700 which would serve as strong support for buying positions.
Despite the uncertainties for Ethereum and Bitcoin, let’s focus on these top 5 altcoins (GALA, SHIB, MATIC, INJ, ADA) ahead of the new week as these tokens could perform better than BTC and ETH.
Top 5 Altcoins – Daily (1D) price analysis of Injective Protocol (INJ).
INJ USDT Daily 1D price chart
The inclusion of Injective Protocol (INJ) in the top 5 altcoins to watch this week is no coincidence as this top token has remained a big player in 2023 as INJ’s price rose from a bottom Soared from $1.5 to a high of $9.9 with over 600% gains outperforming Bitcoin (Bitcoin) and Ethereum (ETH).
INJ price rallied to a high of $9.9 and has struggled to break this area as it remained at its yearly high and the price fell to a $6 area with the bulls still holding the had control.
INJ/USDT price has been rejected multiple times from the $9.9 peak towards $7.9, just above the 50-day EMA as the bulls remain in control of the prices.
The $7.9 area is the 50-day EMA, which serves as support for the INJ/USDT price. If INJ/USDT price closes below $7.9, bears could push INJ/USDT price to $7 and $6 lows.
Fibonacci retracement levels 61.8% and 50.0% (FIB level 61.8% and 50.0%) correspond to USD 7 and USD 6 respectively and act as support areas and bid zones for INJ/USDT buy orders.
Although the price action for INJ looks strong, the emergence of a hidden bearish divergence for the daily RSI and MACD suggests a bullish to bearish trend that still looks healthy for bulls.
The Moving Average Convergence Divergence (MACD) for INJ is suggesting a trend reversal as the price remains likely to trend down.
Major daily resistance for INJ – $9.9
Large daily support for INJ – $7-6
MACD – downtrend
Daily (1D) price analysis for Cardano (ADA)
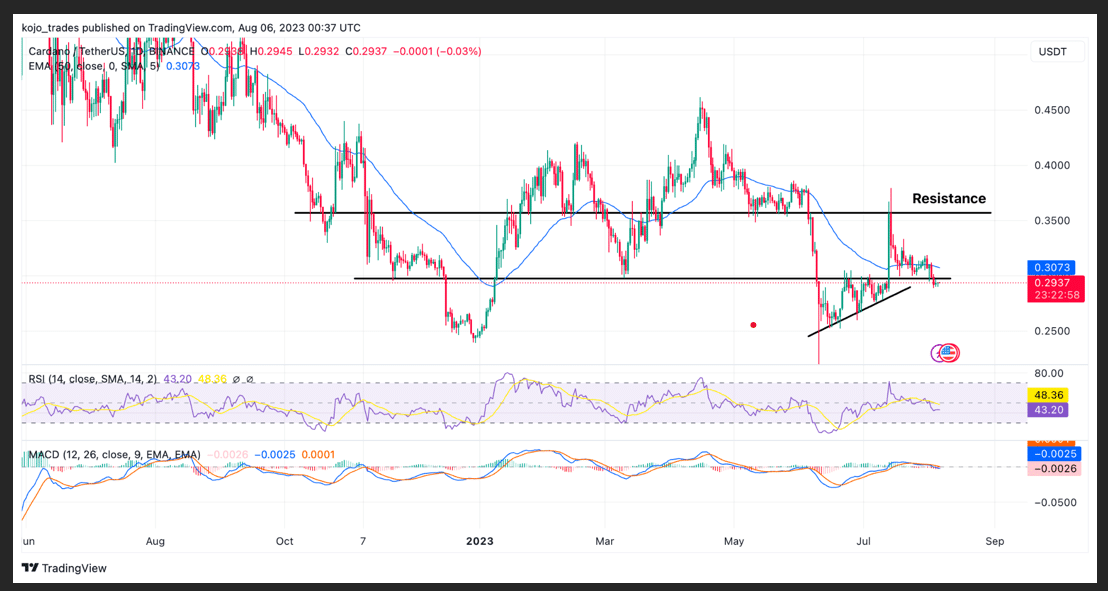 ADA Daily 1D Price Analysis
Cardano price action has been difficult lately as the price got rejected after its bullish price breakout from $0.35, while ADA/USDT price keeps falling as the bears take control of the price.
ADA price failed to close above $0.35 turning this area into a support region as the price met major price rejection from the bears while the bulls struggled to sustain their initial price rally.
The price of ADA remains below the areas important to many bulls as it is below its daily 50-day EMA, which indicates a bearish trend on the 1D timeframe.
If ADA price fails to reclaim the highs of $0.35, bears could drop the price to a low of $0.25 as that could be a good area for the price to see a lot Build momentum for a price rally.
The MACD for ADA on the daily (1D) time frame indicates a bearish price trend for ADA as the price continues its struggle in a bearish trend.
The price action for ADA on both the lower and higher time frames suggests that the bears are largely in control of the price as the RSI is currently trading in favor of the bears below the 50 level.
Major daily resistance for ADA – $0.35
Big daily support for ADA – $0.25
MACD – downtrend
Shiba Inu (SHIB) Daily Price Analysis
 SHIB USDT 1D price chart
Shiba Inu (SHIB) price action remains one of the best price action of the last few days as SHIB/USDT price has been showing many bullish signs of price recovery.
The price of SHIB/USDT plunged to a low of $0.00000600 as the price bounced off this region as many bulls dominated the price and hit a high of $0.000000750 as the price entered bullish ascending triangle formed.
Shiba Inu (SHIB) broke out of its bullish ascending triangle as the price was retesting its support and price was eyeing $0.00001. The price action and indicators are all pointing in one direction for bulls as the price could continue its rally to a high of $0.00001200.
The SHIB/USDT price is facing its big challenge: it breaks and closes above USD 0.00001050, which is its FIB value of 61.8%.
A break and close above this region for SHIB/USDT on higher timeframes could trigger a bullish price rally to $0.00001200.
MACD and RSI on the daily timeframe for SHIB are suggesting bullish price control for SHIB as the price is targeting new highs ahead of a new week as it is among the top 5 altcoins to watch.
Major daily resistance for SHIB – $0.00001050
Major daily support for SHIB – $0.00000850
MACD – Uptrend
Polygon Matic (MATIC) price analysis as top 5 altcoins to keep an eye on
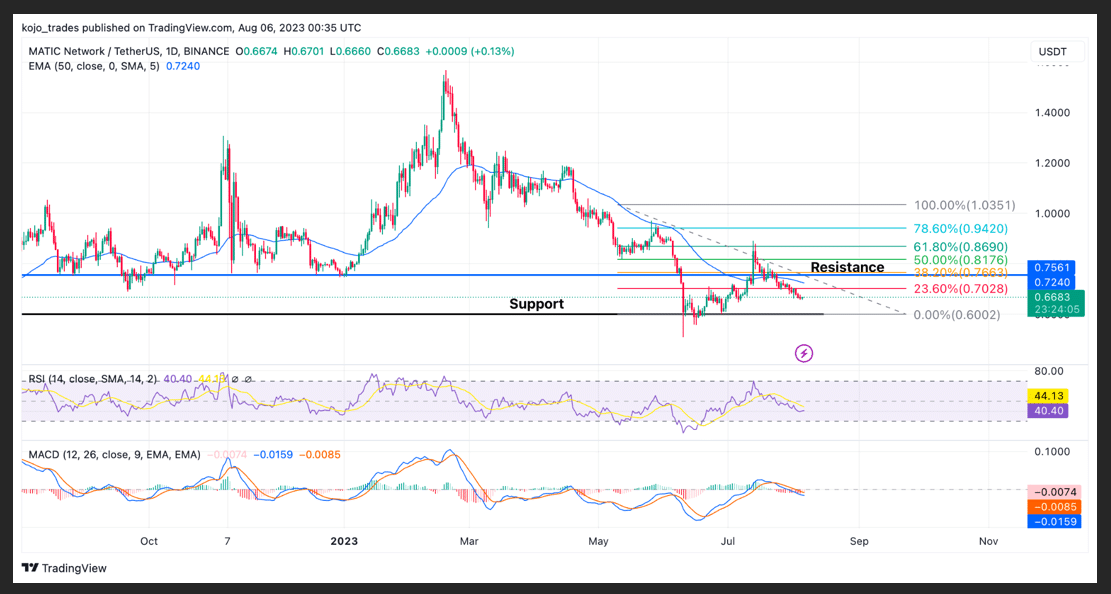 MATIC price chart
MATIC/USDT price struggled to repeat its climb to a high of $1.5 despite strong investor support and many partnerships.
Polygon Matic remains one of the top 5 altcoins with real use cases as many traders and investors look for ways to invest in this token.
MATIC/USDT price suffered a price rejection off USD 1.5 as the price is dominated by bearish price action trading below the 50-day EMA as MATIC price fails to sustain above USD 1 could.
MATIC/USDT price could retest the $0.6 level as the bears seem determined to push the price into this key demand zone as buyers may attempt to initiate a long position on MATIC.
MATIC’s price needs to recover $1, which is the FIB value of 78.6% on the daily timeframe for MATIC. A break and close above $1 could give the bulls more opportunity to push the price to $1.5.
The MACD and RSI on the daily time frame for MATIC are suggesting a bearish price trend as the bears continue to show a lot of strength versus the bulls.
Major daily resistance for MATIC – $0.88-$1
Major daily support for MATIC – $0.6
MACD – downtrend
GALA daily price analysis chart
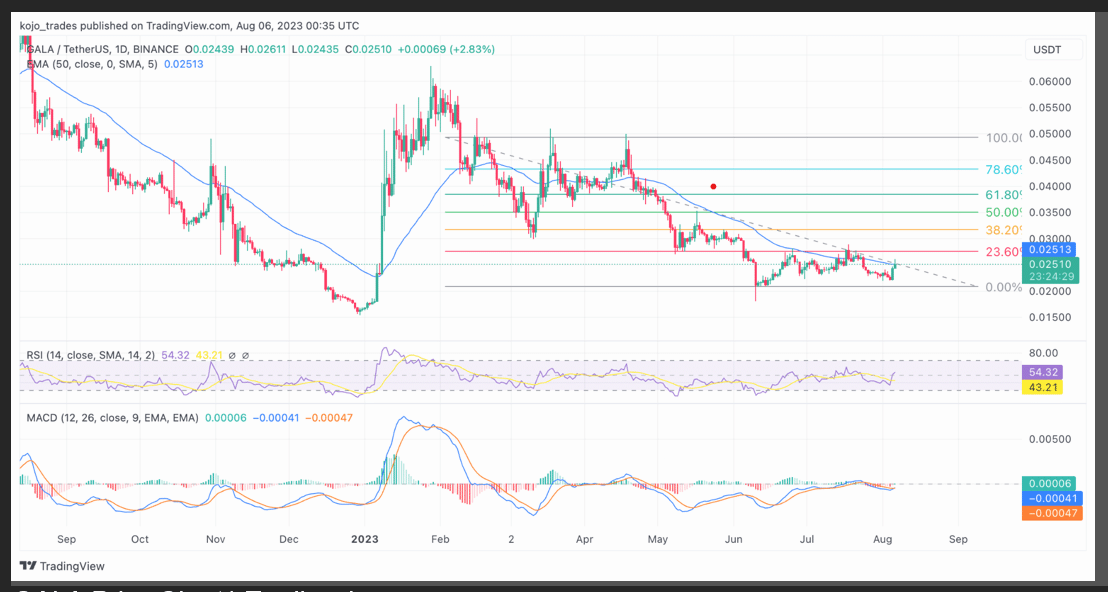 GALA price chart
GALA has emerged as a top five altcoin to watch out for as more game tokens have performed well over the past few days, with companies like Yield Guild Games (YGG) surging in under a couple of hours recorded by over 70%.
GALA’s price has performed well over the past few months as the price surged to a high of $0.06 before suffering a sharp bearish pullback to a low of $0.02 where the price found good support made for the price.
Since then, the price of GALA has traded below its 50-day EMA, which highlights the strong bearish effect in its trend as the price failed to show any bullish price reaction until recently.
Despite its bearish price, GALA could reverse its trend into an uptrend if the price triggers bullish price moves. The price of GALA needs to break and close the 23.6% and 38.2% FIB levels, which are $0.027 and $0.03, respectively.
A close above this region will mean a strong bullish price rally to a high of $0.045 and a high of $0.066.
MACD and RSI indicators are showing a bullish price change from bearish to bullish as bulls continue to dominate GALA’s price.
Major daily resistance for GALA – $0.027-0.03
Big daily support for GALA – $0.02
MACD – Uptrend
Follow us on Twitter and Facebook.
Disclaimer: This content is for informational purposes only and should not be considered financial advice. The views expressed in this article may represent the personal opinion of the author and do not reflect the opinion of The Crypto Basic. Readers are advised to conduct thorough research before making any investment decisions. The Crypto Basic accepts no liability for any financial loss.
-Advertising-
Learn Crypto Trading, Yield Farms, Income strategies and more at CrytoAnswers
https://nov.link/cryptoanswers
Comments are closed.