


In May, bitcoin (BTC) price saw a slight decline and fluctuated between $25,800 and $30,000. However, the monthly open and close prices were significantly closer, which brings us to the May BTC price prediction: even though the price action has been contained, the future development remains uncertain and intriguing
These four analysts used different methods to predict market volatility, but came to a similarly accurate conclusion.
Elliott Wave Count correctly predicts the downturn
Elliott Wave Theory involves analysis of recurring long-term price patterns and investor psychology to determine the direction of a trend. In May, the trading methodology accurately predicted the local top and subsequent decline.
In early May, Elliott Wave specialist @TheTradingHubb tweeted that the price would make a local top near $30,000 and then drop towards $26,500.
The price rallied on May 1st (green icon) and reached a local top near $30,000 (red icon) as predicted.
Subsequently, well-known trader @Altstreetbet tweeted that the price would start another upleg (green circle) before finally capitulating towards $20,000. While the sharp capitulation is yet to come, the weak bounce and a downturn (red circle) have already happened.
BTC/USDT daily chart. Source: TradingView
A decline to the $25,000 support line is likely due to the descending parallel channel. However, a breakdown is needed for the price to drop to $20,000.
A breakout of the channel would invalidate this bearish BTC price prediction. In that case, an upward move to $30,000 could occur.
The head and shoulders pattern catalyzes the breakdown
Cryptocurrency trader @Anbessa100 tweeted a head and shoulders pattern. The pattern suggests that BTC price will collapse and fall towards $25,000.
While the price failed to reach the $25,000 target, it broke (red icon) and fell to a low of $25,800.
A similar view was taken by @LomaCrypto, who used only horizontal planes to determine the resulting bottom.
The bounce that followed was strong, but not enough to retake the pattern’s neckline. As long as BTC trades below this line, the trend is bearish. This outlook also fits the descending parallel channel outlined earlier.
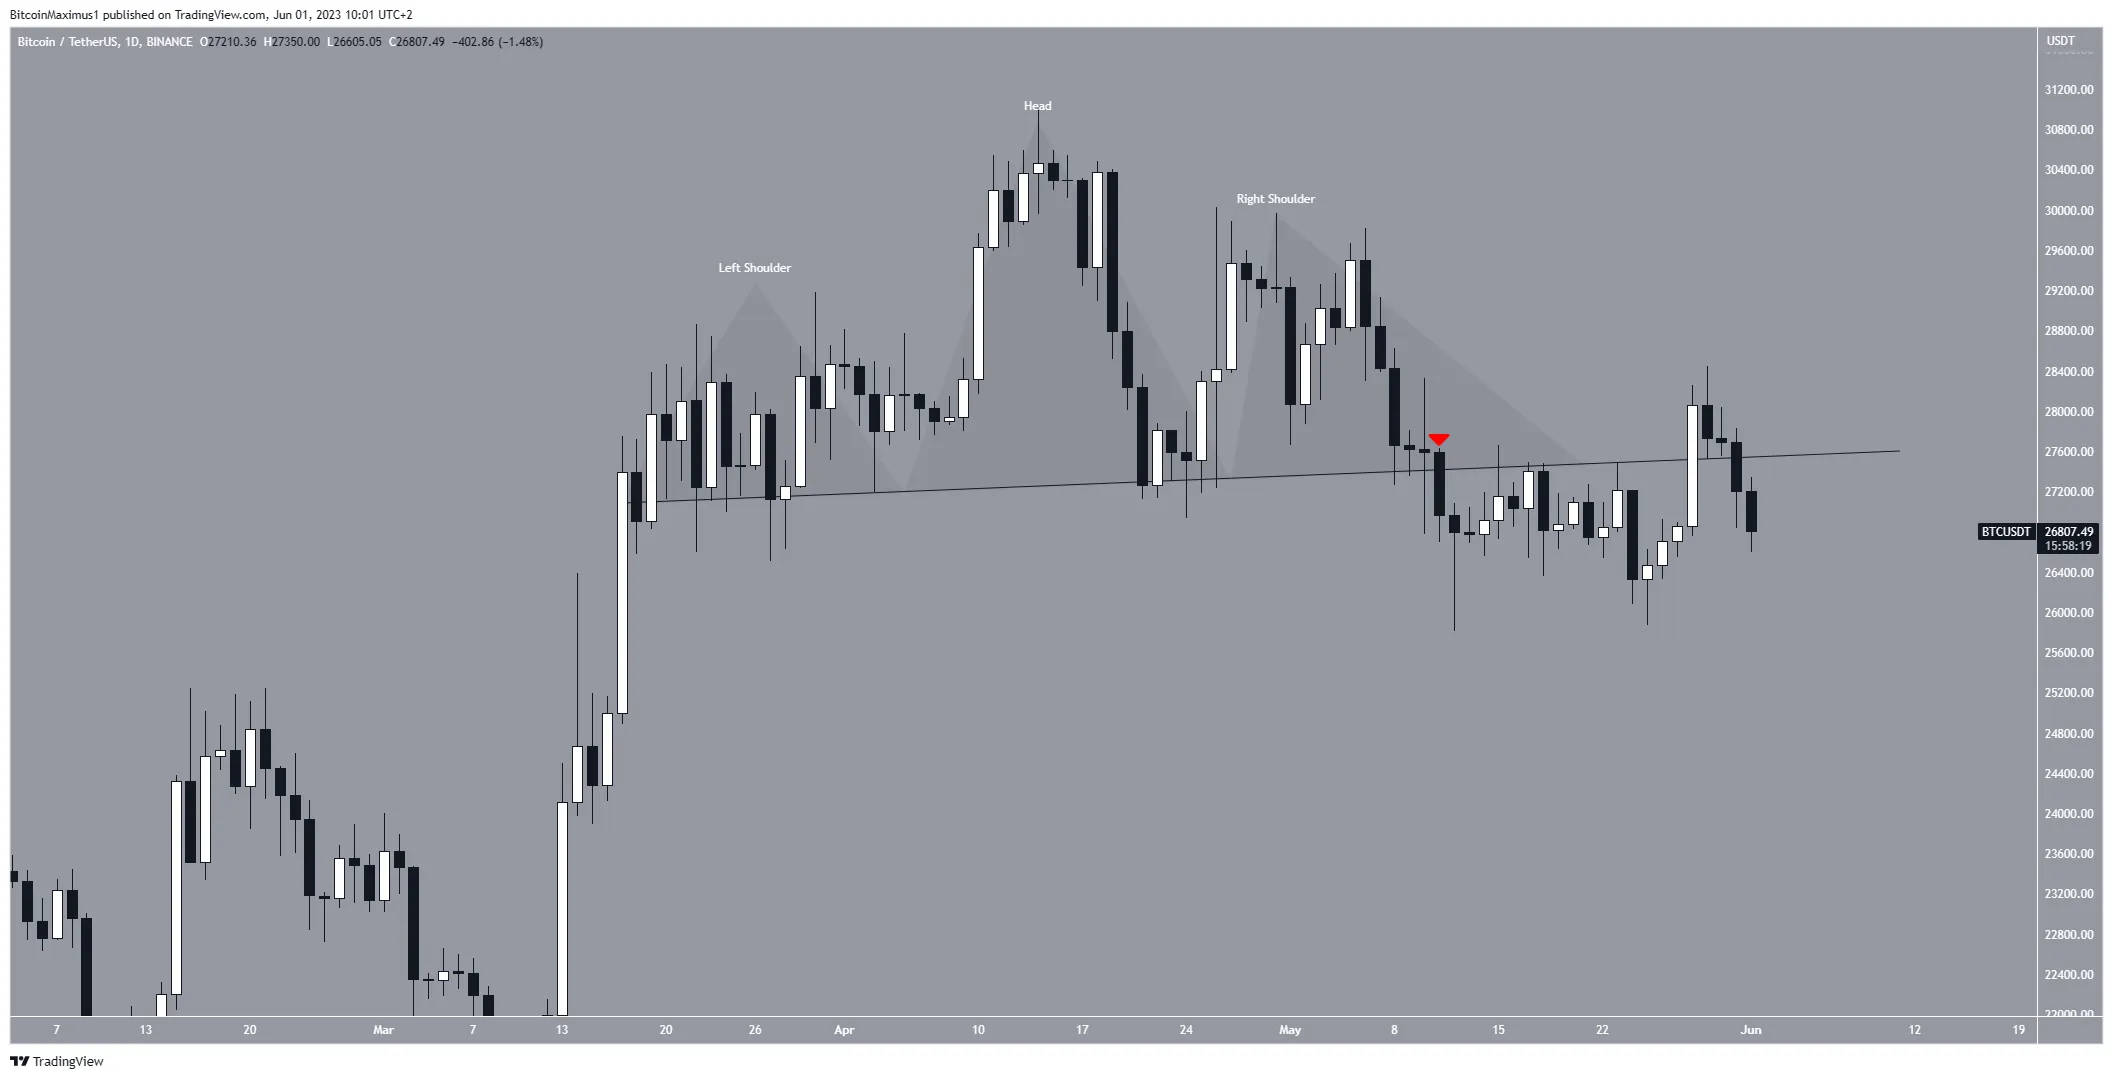 BTC/USDT daily chart. Source: TradingView
A move above the neckline would not confirm the bullish reversal as the price would still be below the channel resistance line. So, a close above $28,500 will confirm the bullish reversal.
For BeInCrypto’s latest crypto market analysis, click here
Disclaimer
In accordance with Trust Project guidelines, this price analysis article is for informational purposes only and should not be considered financial or investment advice. BeInCrypto is committed to accurate, unbiased reporting, however, market conditions are subject to change without notice. Always do your own research and consult a professional before making any financial decisions.
Learn Crypto Trading, Yield Farms, Income strategies and more at CrytoAnswers
https://nov.link/cryptoanswers
Comments are closed.