


Solana price traded sideways as the altcoin failed to surpass the $40 price mark. The altcoin recently took a hit when thousands of wallets were stripped of their assets due to an exploit. The latest exploit had allowed hackers to siphon off the funds using private keys.
After the network attack, Solana’s value quickly dropped to $38. Solana price is now stuck at the $40 level.
The current support level for the coin was $40 and if SOL fails to stay at the above price level, SOL could drop to $36. Bitcoin has also consolidated at the $23,000 level after the king coin fell slightly on its chart over the past two days. Altcoins are also affected in a similar way.
In the case of Solana, the coin’s purchasing power plummeted due to the recent fiasco. Fortunately, only a certain number of wallets were affected and the Solana network was not compromised. The global cryptocurrency market cap today was $1.14 trillion, a 0.4% negative change in the last 24 hours.
Solana price analysis: four hour chart
Solana was priced at $40.2 on the four-hour chart | Source: SOLUSD on TradingView
SOL was changing hands at $40.2 at the time of writing. The coin has still not recovered from the correction it experienced after surpassing the $46 price mark.
The recent loss of money from some accounts has definitely set back Solana’s recovery.
Overhead resistance for the coin stood at $41, but Solana price will be able to invalidate the bearish thesis once it manages to revisit and sustain its price above the $46 price level.
On the upside, the support level for Solana price was $36. A fall of $36 will take the asset to $34. Solana’s volume traded during the last session declined slightly, indicating a drop in selling strength.
If Solana price resumes its downtrend, the altcoin will soon be trading below the ascending triangle, which will confirm the downside move.
Technical Analysis
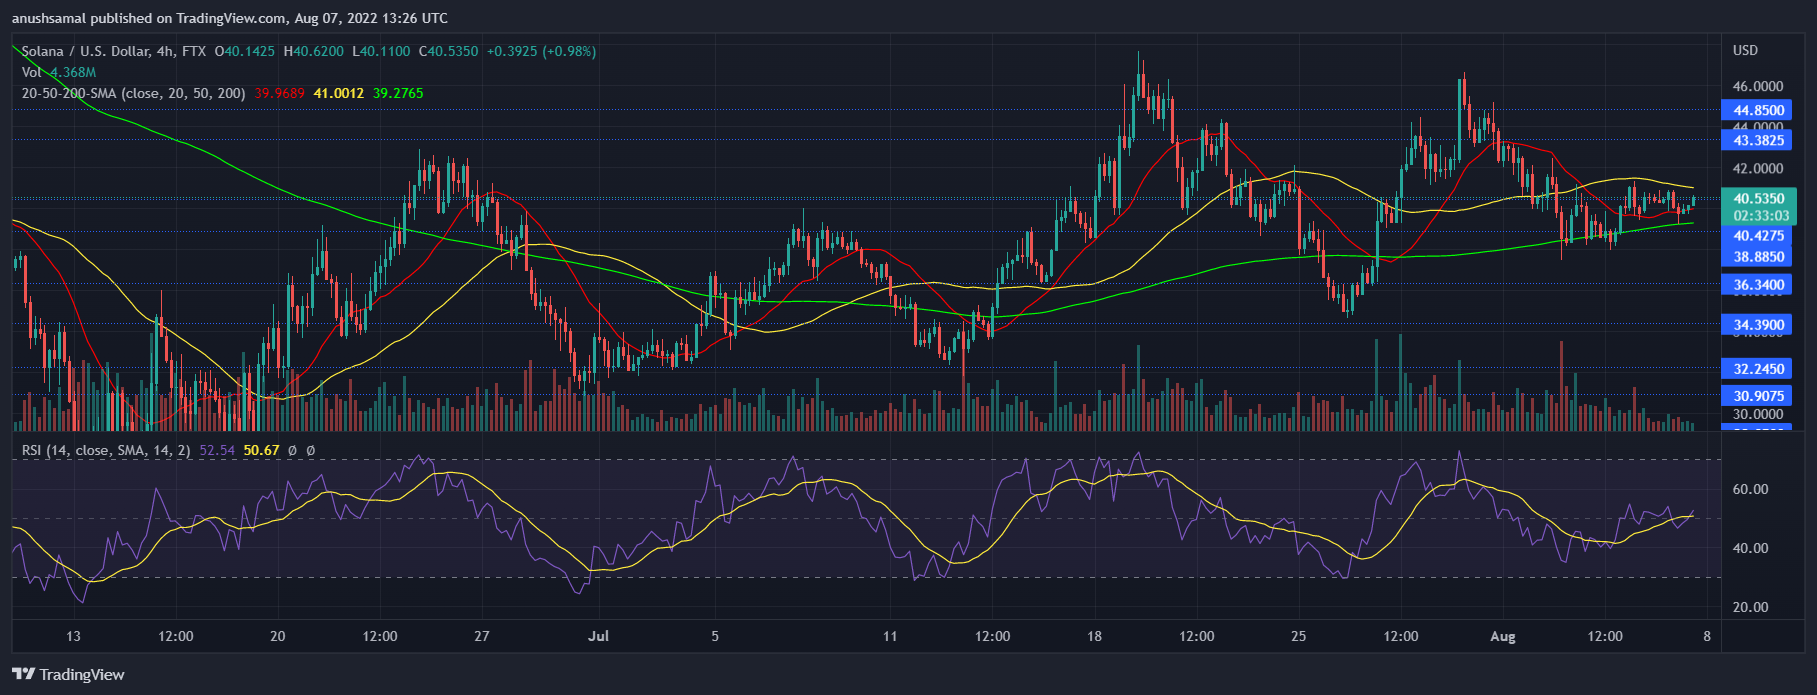 Solana showed an increase in purchasing power on the four hour chart | Source: SOLUSD on TradingView
The altcoin saw a drop in buying pressure as Solana holders ran to sell the coin due to . About the attack. However, in the last couple of trading sessions, the coin showed an increase in purchasing power.
The Relative Strength Index was hovering above the half line meaning that the buyers were overwhelming the sellers at the time of writing.
Solana price was also seen above the 20 SMA line which meant that the buyers were driving the price momentum in the market.
This could be bullish price action for the coin. If the buyers hold their position in the market, SOL could break its consolidation soon.
Related Reading: Solana hot wallets suffer ongoing attacks, around $5 million stolen so far
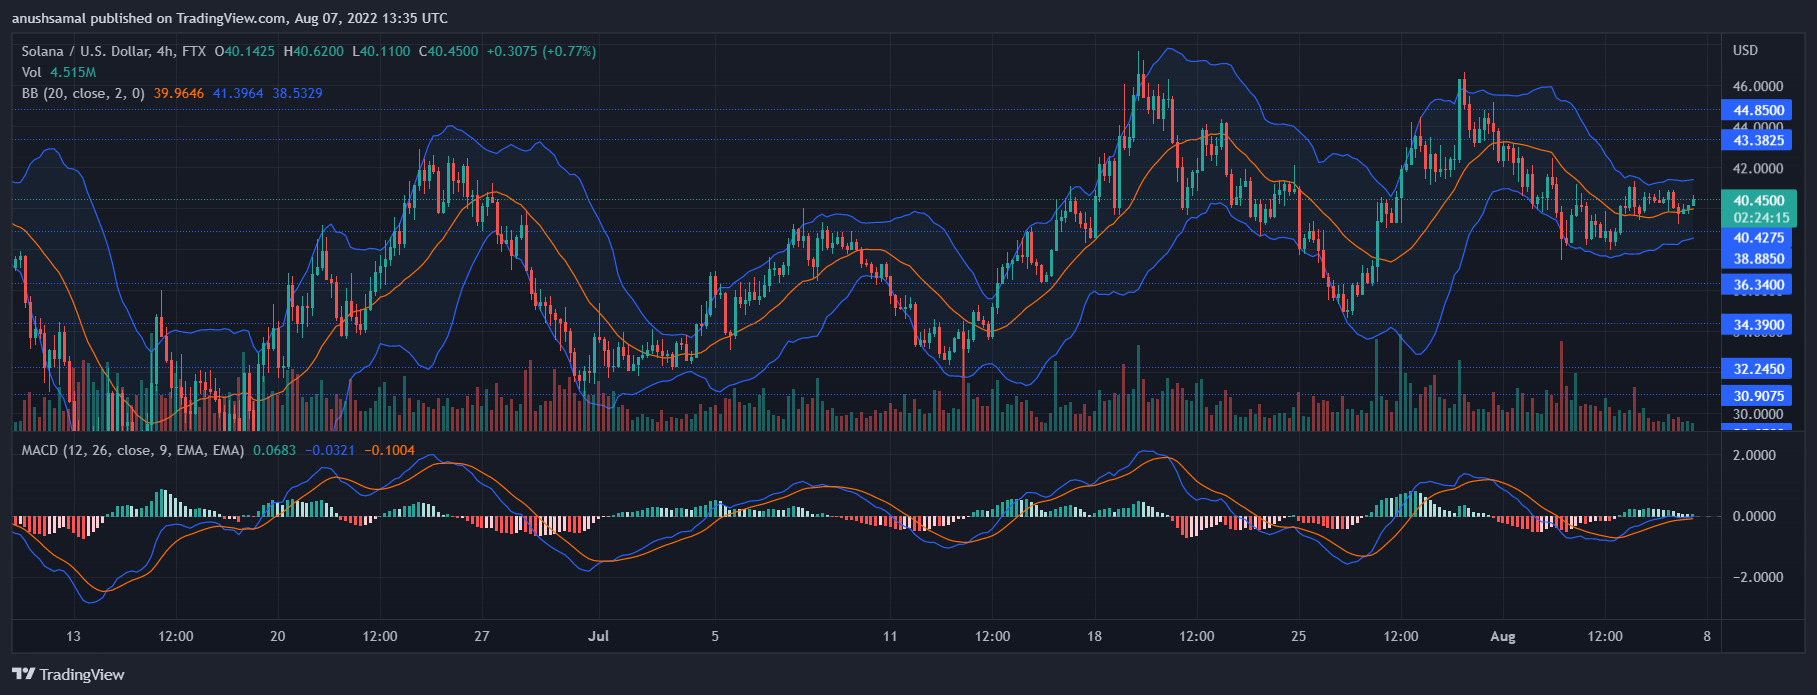 Solana demonstrated a buy-signal on the four hour chart | Source: SOLUSD on TradingView
SOL’s technical outlook indicated upward movement on the chart. Moving Average Convergence Divergence showed the price momentum and trend change. MACD flashed green histograms after a bullish crossover.
This reading was tied to a buy signal for Solana. Bollinger Bands indicate price volatility and fluctuations in price. The bands were wide and parallel which meant that Solana price will not experience heavy volatility.
Related Reading: TA: Solana Struggles to Break Key Resistance After $5M Hack
Featured image from US News Money, charts from TradingView.com
Learn Crypto Trading, Yield Farms, Income strategies and more at CrytoAnswers
https://nov.link/cryptoanswers
Comments are closed.