


Bitcoin’s (BTC) journey towards widespread acceptance and optimism has recently reached new heights.
A notable milestone is the jump in BTC holdings by long-term investors, which reached a record 14.59 million coins, which is 75% of the circulating supply.
That figure marks a new all-time high for Bitcoin “HODLers,” Checkmate, Glassnode’s lead on-chain analyst, announced on Aug. 7.
“New all-time high for Bitcoin long-term holder supply, now at $14.59M BTC (75% of circulation).”
– As the Glassnode analyst noted in the Aug. 7 tweet.
BTC long term vs short term supply. Source: Glassnode Analyst Checkmate
This stat shows a firm belief in Bitcoin’s enduring value as veteran holders continue to place their faith in its potential.
Additionally, the surge also underscores Bitcoin’s evolution from a speculative asset to an impressive store of value, reinforces its position as a central player in the financial landscape, and underscores its path to mainstream recognition.
Meanwhile, the bitcoin supply held by short-term holders has been in a strong uptrend since early 2021 and is currently around 11 million BTC.
Bitcoin price analysis
At the time of writing, Bitcoin was changing hands at $29,576, down more than 0.8% over the past 24 hours.
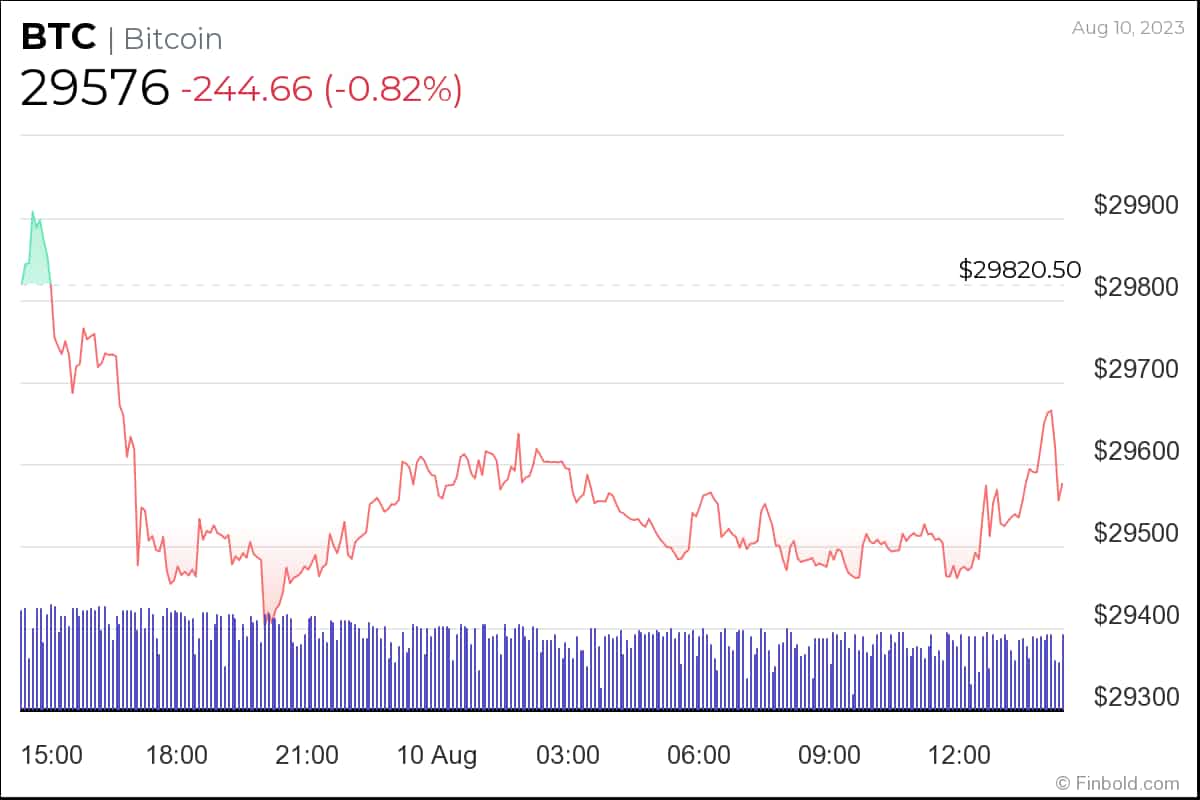
The leading cryptocurrency is up 1.3% over the past week, despite still being down more than 2.3% on the monthly chart.
Still, Bitcoin’s year-to-date returns are resilient, hovering near 80%.
It’s evident that Bitcoin’s recent price action has done little to excite crypto investors. The largest cryptocoin recaptured the $30,000 mark on Aug. 9, but only for a short time before falling below that psychological threshold.
However, there are some signs that better days may be on the way for BTC, at least considering the historical chart patterns that have historically led to bullish moves.
More specifically, there is a chance for Bitcoin to experience parabolic movement, with the BTC chart showing a bottom formation similar to those seen in 2016 and 2020, which preceded a strong bull market.
Disclaimer: The content of this website should not be construed as investment advice. Investing is speculative. When you invest, your capital is at risk.
Learn Crypto Trading, Yield Farms, Income strategies and more at CrytoAnswers
https://nov.link/cryptoanswers
Comments are closed.