


Bitcoin (BTC) price has been falling since January 11, hitting its low of $39,430 yesterday.
BTC broke a key horizontal support area. Does this mean the local top is in?
Bitcoin continues to fall
Weekly technical analysis on the time frame shows that BTC price has been rising within an ascending parallel channel since the beginning of 2023. The price broke out of the channel in November and reached a peak of $48,969 in January 2024. The peak coincided with the approval of the Bitcoin Exchange Traded Fund (ETF).
Since then, BTC price has fallen, resulting in a bearish shooting star candle. This week it is moving within the boundaries of the channel and approaching its midline, which coincides with a Fib support level.
BTC/USDT weekly chart. Source: TradingView
The weekly RSI is providing a bearish reading. Market traders use the RSI as a momentum indicator to identify overbought or oversold conditions and decide whether to accumulate or sell an asset.
Readings above 50 and an uptrend suggest bulls still have the advantage, while readings below 50 suggest the opposite. While the indicator is still above 50, it fell below 70 (black symbol), which is a sign of a weakening trend.
Read more: Where to trade Bitcoin futures
What do the analysts say?
Cryptocurrency traders and analysts on X have a bearish outlook on the future trend. Honey_xbt drew simple horizontal ranges to note rejection from $50,000 and predict a subsequent decline to $35,000.
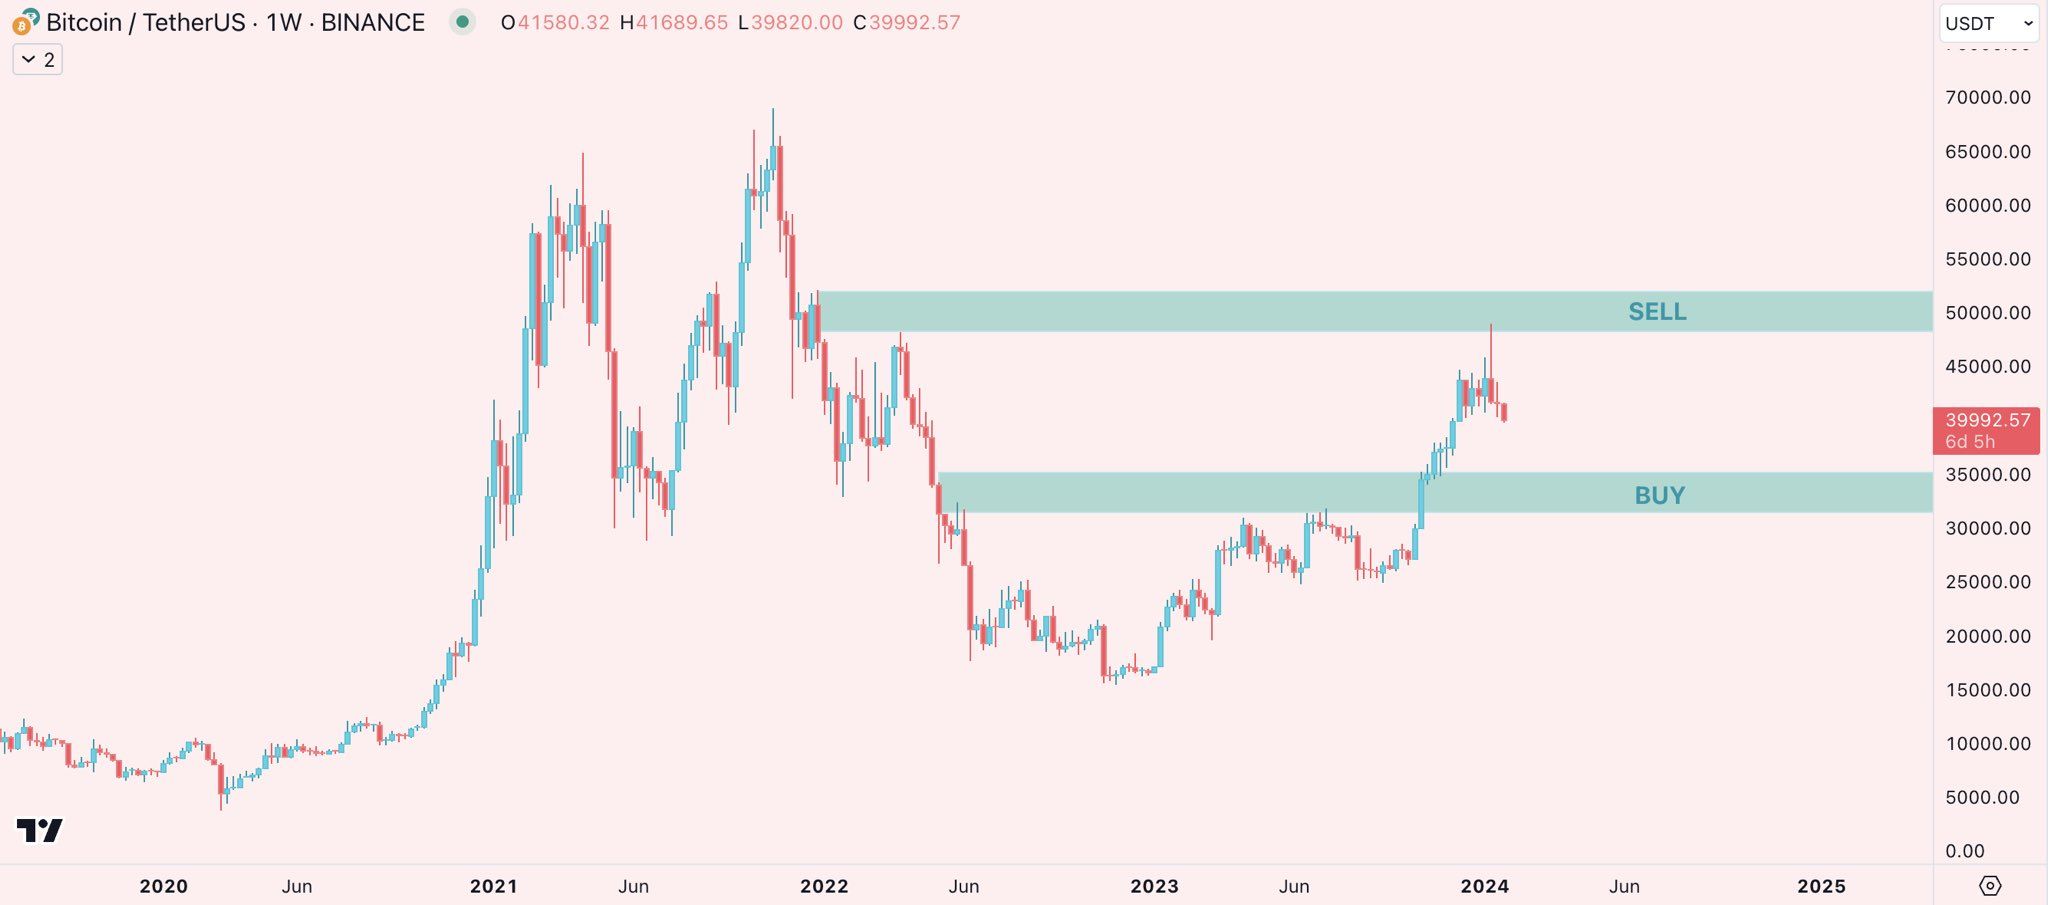 BTC/USDT weekly chart. Source: X
Cold Blooded Shiller is bearish based on price action and indicator readings. He tweeted:
Renko also shows this dynamic shift in $BTC very well. Significant downward pressure (not seen for over 18 months, but to be treated with caution given the repaint) – but the AO is strengthening. Also the clear support compromise at $40,000.
Income Sharks expects BTC price to fall below most major support levels until it reaches $32,000.
Read more: Who will own the most Bitcoins in 2024?
BTC Price Prediction: Has the price reached a peak?
The technical analysis on the daily time frame is consistent with the bearish analysis on the weekly chart based on price action and RSI values.
The chart shows that BTC price broke the $41,000 horizontal support area that had held for 48 days. There was no significant rebound after the collapse and Bitcoin is still trading below this range.
The daily RSI also suggests a bearish trend. The indicator fell below 50 (red symbol) for the first time since the bull run began on October 16, 2023 (green symbol). This is a sign that the previous uptrend has ended and a downtrend has begun.
Read more: What is a Bitcoin ETF?
If the decline continues, BTC could fall 5% to the .5 Fib Retracement support at $36,900 or 12% to the .618 Fib Retracement level at $34,000.
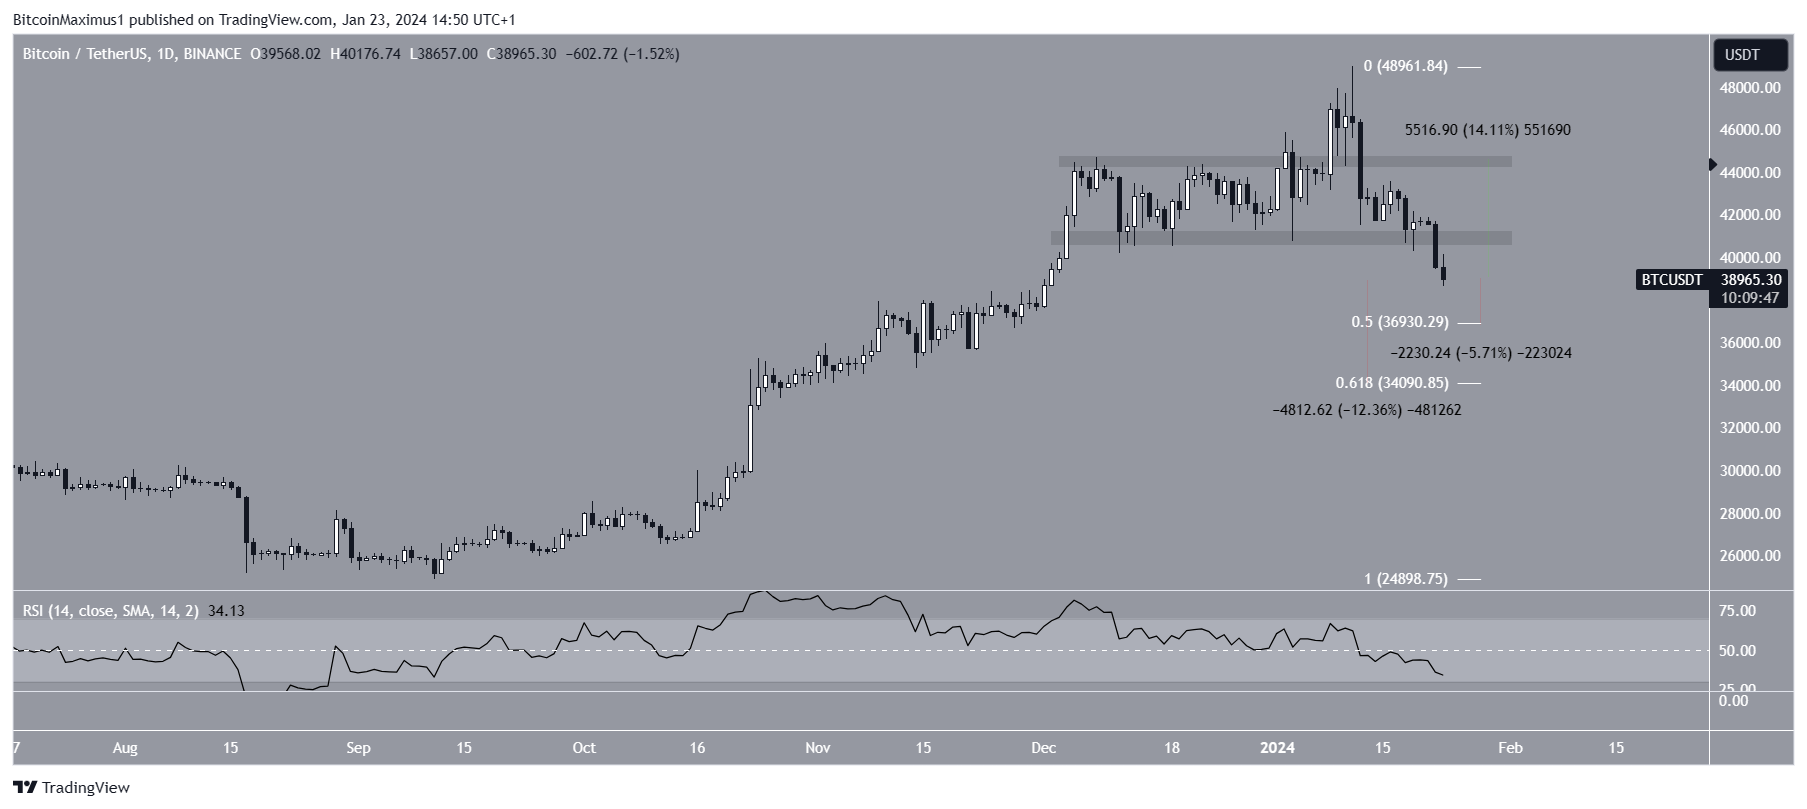 BTC/USDT daily chart. Source: TradingView
Despite the bearish BTC price prediction, reclaiming the $41,000 horizontal area could lead to a 14% increase to the previous range high of $44,000.
For the latest crypto market analysis from BeInCrypto, click here
Disclaimer
In accordance with Trust Project policies, this pricing analysis article is for informational purposes only and should not be considered financial or investment advice. BeInCrypto is committed to accurate, unbiased reporting, but market conditions are subject to change without notice. Always do your own research and consult a professional before making any financial decisions. Please note that our Terms and Conditions, Privacy Policy and Disclaimers have been updated.
Learn Crypto Trading, Yield Farms, Income strategies and more at CrytoAnswers
https://nov.link/cryptoanswers
Comments are closed.