


Ethereum (ETH) price is struggling to regain a footing since it deviated above the $1,660 resistance area. But despite this struggle, Ethereum is expected to outperform Bitcoin (BTC).
Ethereum (ETH) Price Decline Coming?
Technical analysis from the daily timeframe shows that Ethereum’s price action presents a mixed outlook. First, ETH price broke out of a descending resistance line and confirmed it as support (green icon) on Feb 13. After that, it hit a new yearly high on February 16 at $1,742.
However, the price has since fallen. The drop shows that the previous breakout is just a deviation (red circle) above the $1,660 resistance area and the latter is still intact.
Currently, the ETH price is approaching the resistance line of the channel again. However, there is strong support at $1,408 created by the channel support line and the 0.5 Fib retracement support level.
As the daily RSI falls, a drop to this level is the most likely scenario.
On the other hand, reclaiming the $1,660 resistance area would invalidate this bearish forecast. In that case, ETH price could surge to $2,000.
ETH/USDT daily chart. Source: TradingView
Similar to the price action, Ethereum news is also mixed. On March 2nd, an Ethereum blockchain network upgrade was deployed, bringing various improvements to the Ethereum ecosystem.
The upgrade will address decentralized applications and smart contract features. Ethereum’s burn rate has declined significantly since mid-February, likely due to reduced interest in the non-fungible token (NFT) market. Finally, since the Securities and Exchange Commission (SEC) has not made a decision on Ethereum’s classification, there is a risk of the token being branded as a security. If so, it would be subject to numerous regulatory requirements.
Ethereum (ETH) Bullish vs. Bitcoin (BTC)
While the ETH/USDT chart is providing mixed readings, the Ethereum vs. Bitcoin price action and indicator readings are decidedly bullish.
First, the price created a double bottom at the support line of a descending channel. The double bottom is considered a bullish pattern and channels usually lead to breakouts. Furthermore, this entire move was combined with a bullish divergence in the daily RSI (green line).
As a result, a rise towards the resistance line and the ₿0.078 area is likely.
On the other hand, a breakdown of the channel would invalidate this bullish outlook and could trigger a drop to the 0.618 Fib retracement support level at ₿0.063.
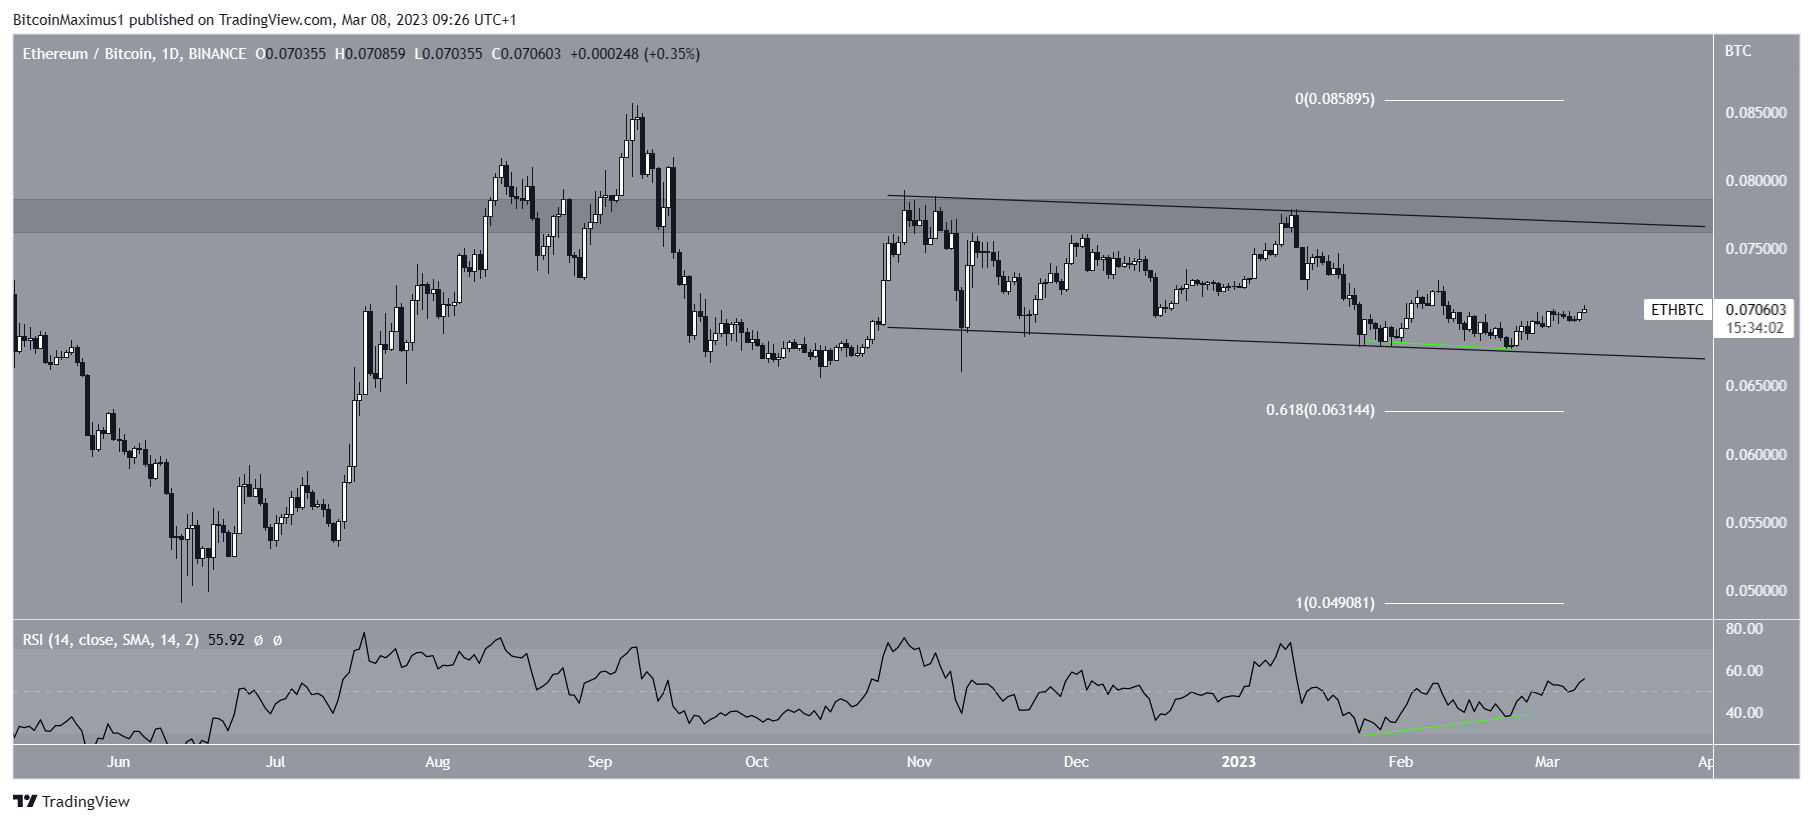 ETH/BTC daily chart. Source: TradingView
To sum up, while the direction of the ETH/USDT trend is unclear, the ETH/BTC movement is bullish. Expected to rise to confluence of resistance levels at ₿0.078. A breakdown of the channel would invalidate this and could trigger a drop to ₿0.063.
For BeInCrypto’s latest crypto market analysis, click here.
Sponsored Sponsored
Disclaimer
BeInCrypto strives to provide accurate and up-to-date information, but accepts no responsibility for missing facts or inaccurate information. You agree and understand that you should use this information at your own risk. Cryptocurrencies are highly volatile financial assets, so do your research and make your own financial decisions.
Learn Crypto Trading, Yield Farms, Income strategies and more at CrytoAnswers
https://nov.link/cryptoanswers
Comments are closed.