

Bitcoin price started another decline from the $67,000 zone. BTC is showing bearish signs and could soon revisit the $61,000 support zone.
- Bitcoin failed to clear the $67,000 resistance zone.
- The price is below $65,000 and the 100 hourly simple moving average.
- There was a break below a rising channel with support at $64,900 on the hourly chart of the BTC/USD pair (data feed from Kraken).
- The pair could continue its decline unless it clears the $65,000 resistance zone.
The Bitcoin price recovery is stagnating
Bitcoin price attempted a recovery wave above the $65,000 resistance zone. BTC even climbed above $66,200, but the bears were active near the $67,000 zone.
A high was formed at $66,898 and the price began to decline again amid increasing tensions between Israel and Iran. There was a move below the $65,000 and $64,000 levels. The price traded below the 50% Fib retracement level of the upward move from the swing low of $60,495 to the high of $66,898.
There was a break below a rising channel with support at $64,900 on the hourly chart of the BTC/USD pair. Bitcoin is currently trading below $65,000 and the 100 hourly simple moving average. The bulls are now protecting the 61.8% Fib retracement level of the upward move from the swing low of $60,495 to the high of $66,898 at $63,000.
The immediate resistance is near the $63,750 level. The first major resistance could be at $64,700. The next resistance is now at $65,000. If there is a clear move above the $65,000 resistance zone, the price could rise further. In the mentioned case, the price could rise towards $66,800 and the 100 hourly simple moving average.
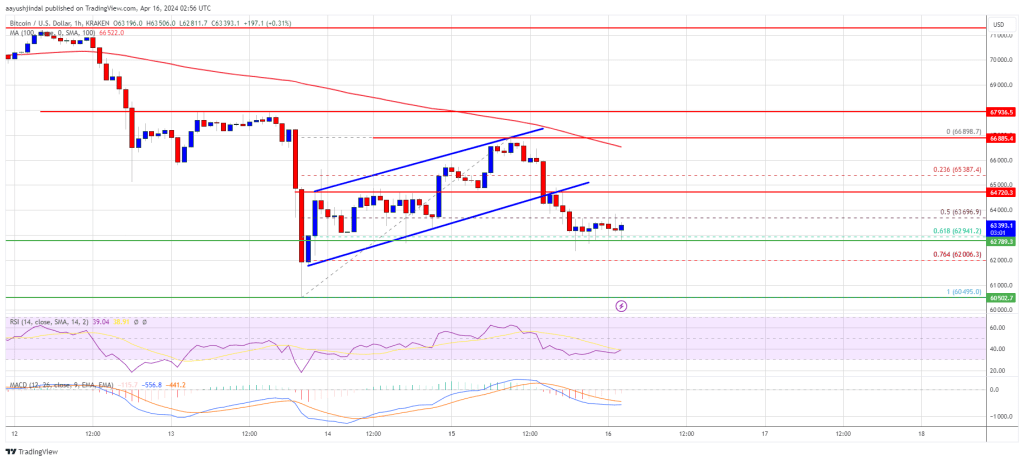
Source: BTCUSD on TradingView.com
The next major resistance is near the $67,200 zone. Further gains could push Bitcoin towards the $70,000 resistance zone in the short term.
More losses on BTC?
If Bitcoin fails to rise above the $65,000 resistance zone, another decline could occur. The immediate downside support is near the $63,000 level.
The first major support is $62,000. If the close is below $62,000, the price could start falling towards the $61,000 level. Any further losses could push the price towards the $60,500 support zone in the near term.
Technical indicators:
Hourly MACD – The MACD is now losing pace in the bearish zone.
Hourly RSI (Relative Strength Index) – The RSI for BTC/USD is now below the 50 level.
Main support levels – $63,000, followed by $62,000.
Major resistance levels – $64,700, $65,000 and $67,000.
Learn Crypto Trading, Yield Farms, Income strategies and more at CrytoAnswers
https://nov.link/cryptoanswers
Comments are closed.