


Denys Serhiichuk
Can we expect a slight correction in Bitcoin (BTC) before another surge?
While bulls are still controlling the market, some coins have already entered a correction phase.
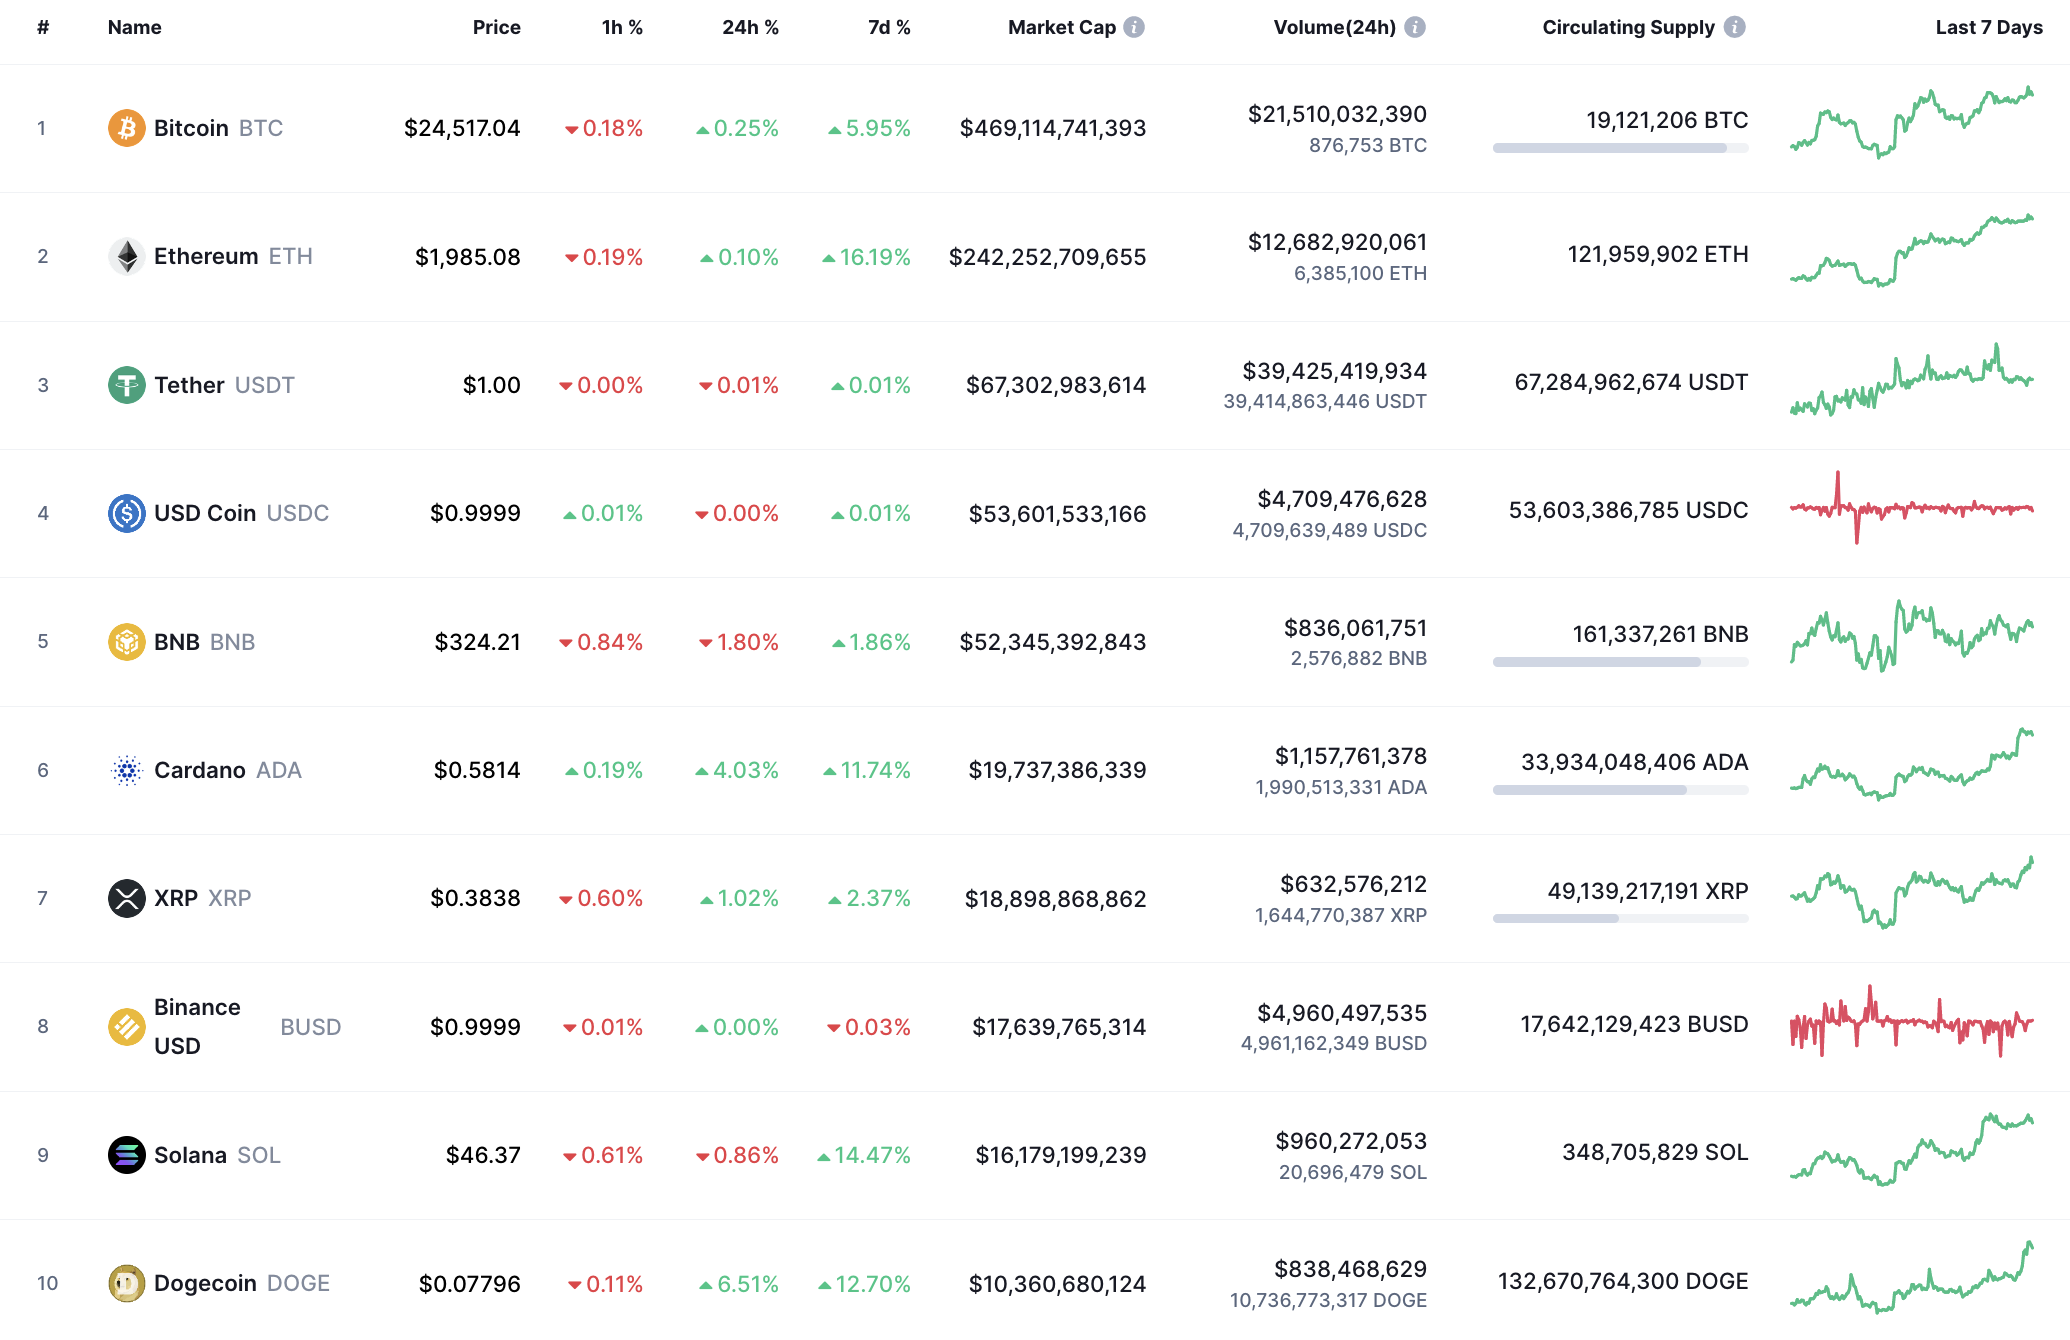
BTC/USD
Bitcoin’s price is almost unchanged since yesterday, while the price is up 5.85% over the past week.
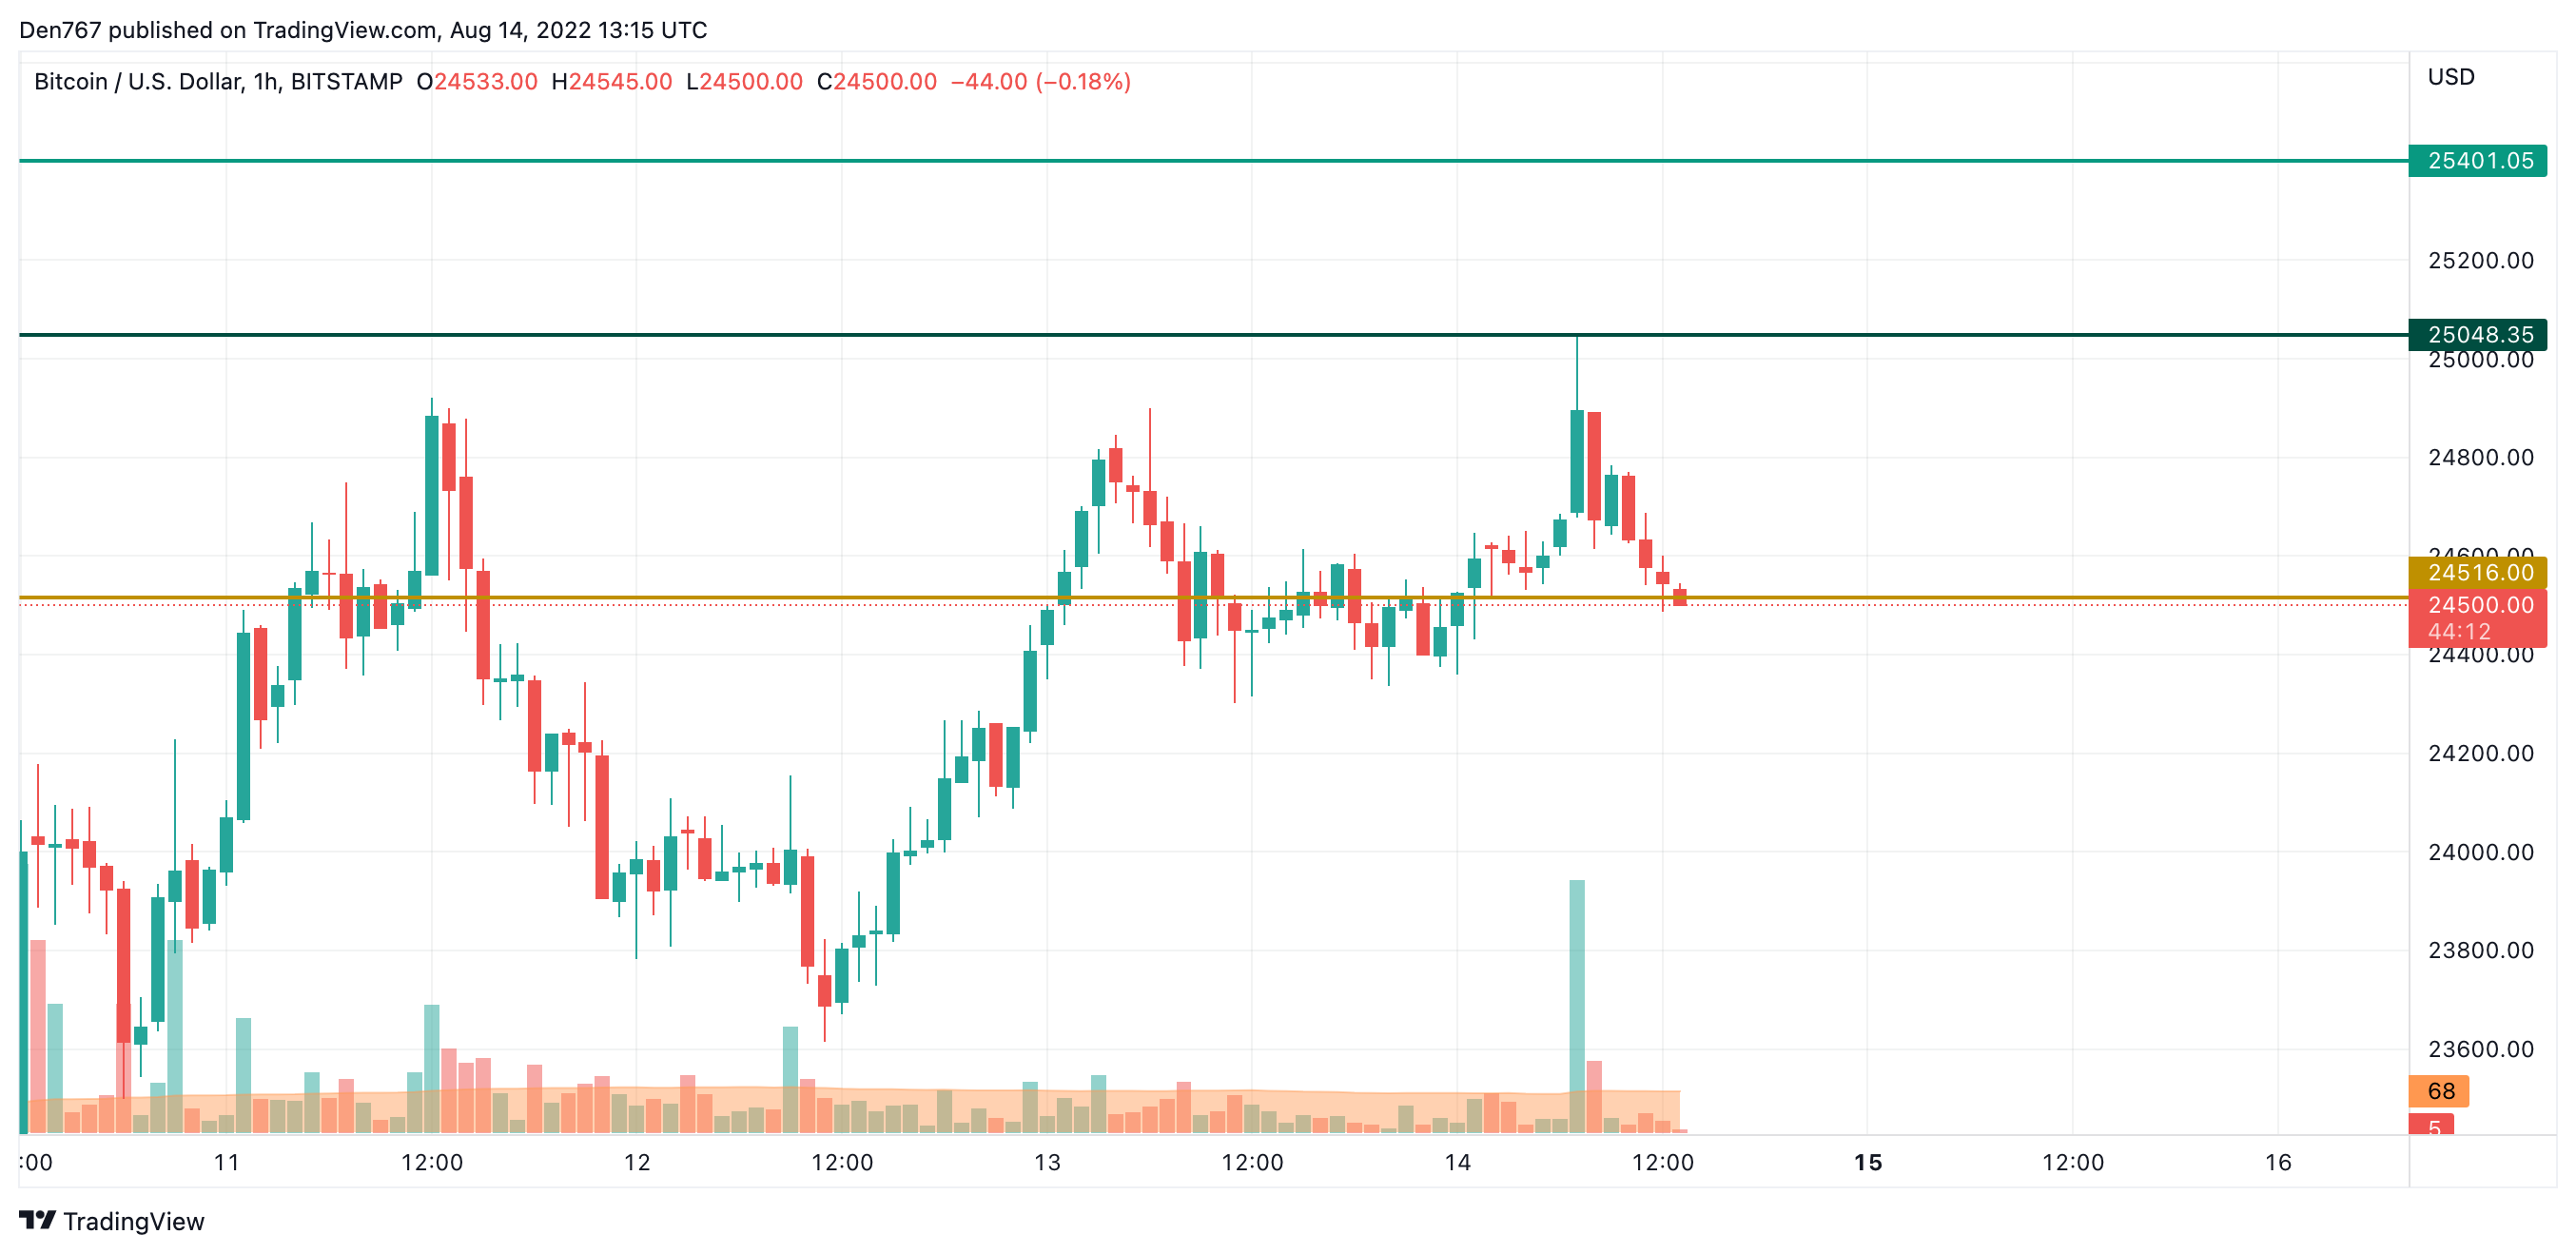
On the hourly chart, Bitcoin (BTC) broke the local support level at $24,516. If buyers fail to restore the initiative, a sharp drop to $24,200-$24,400 is in sight by the end of the day.
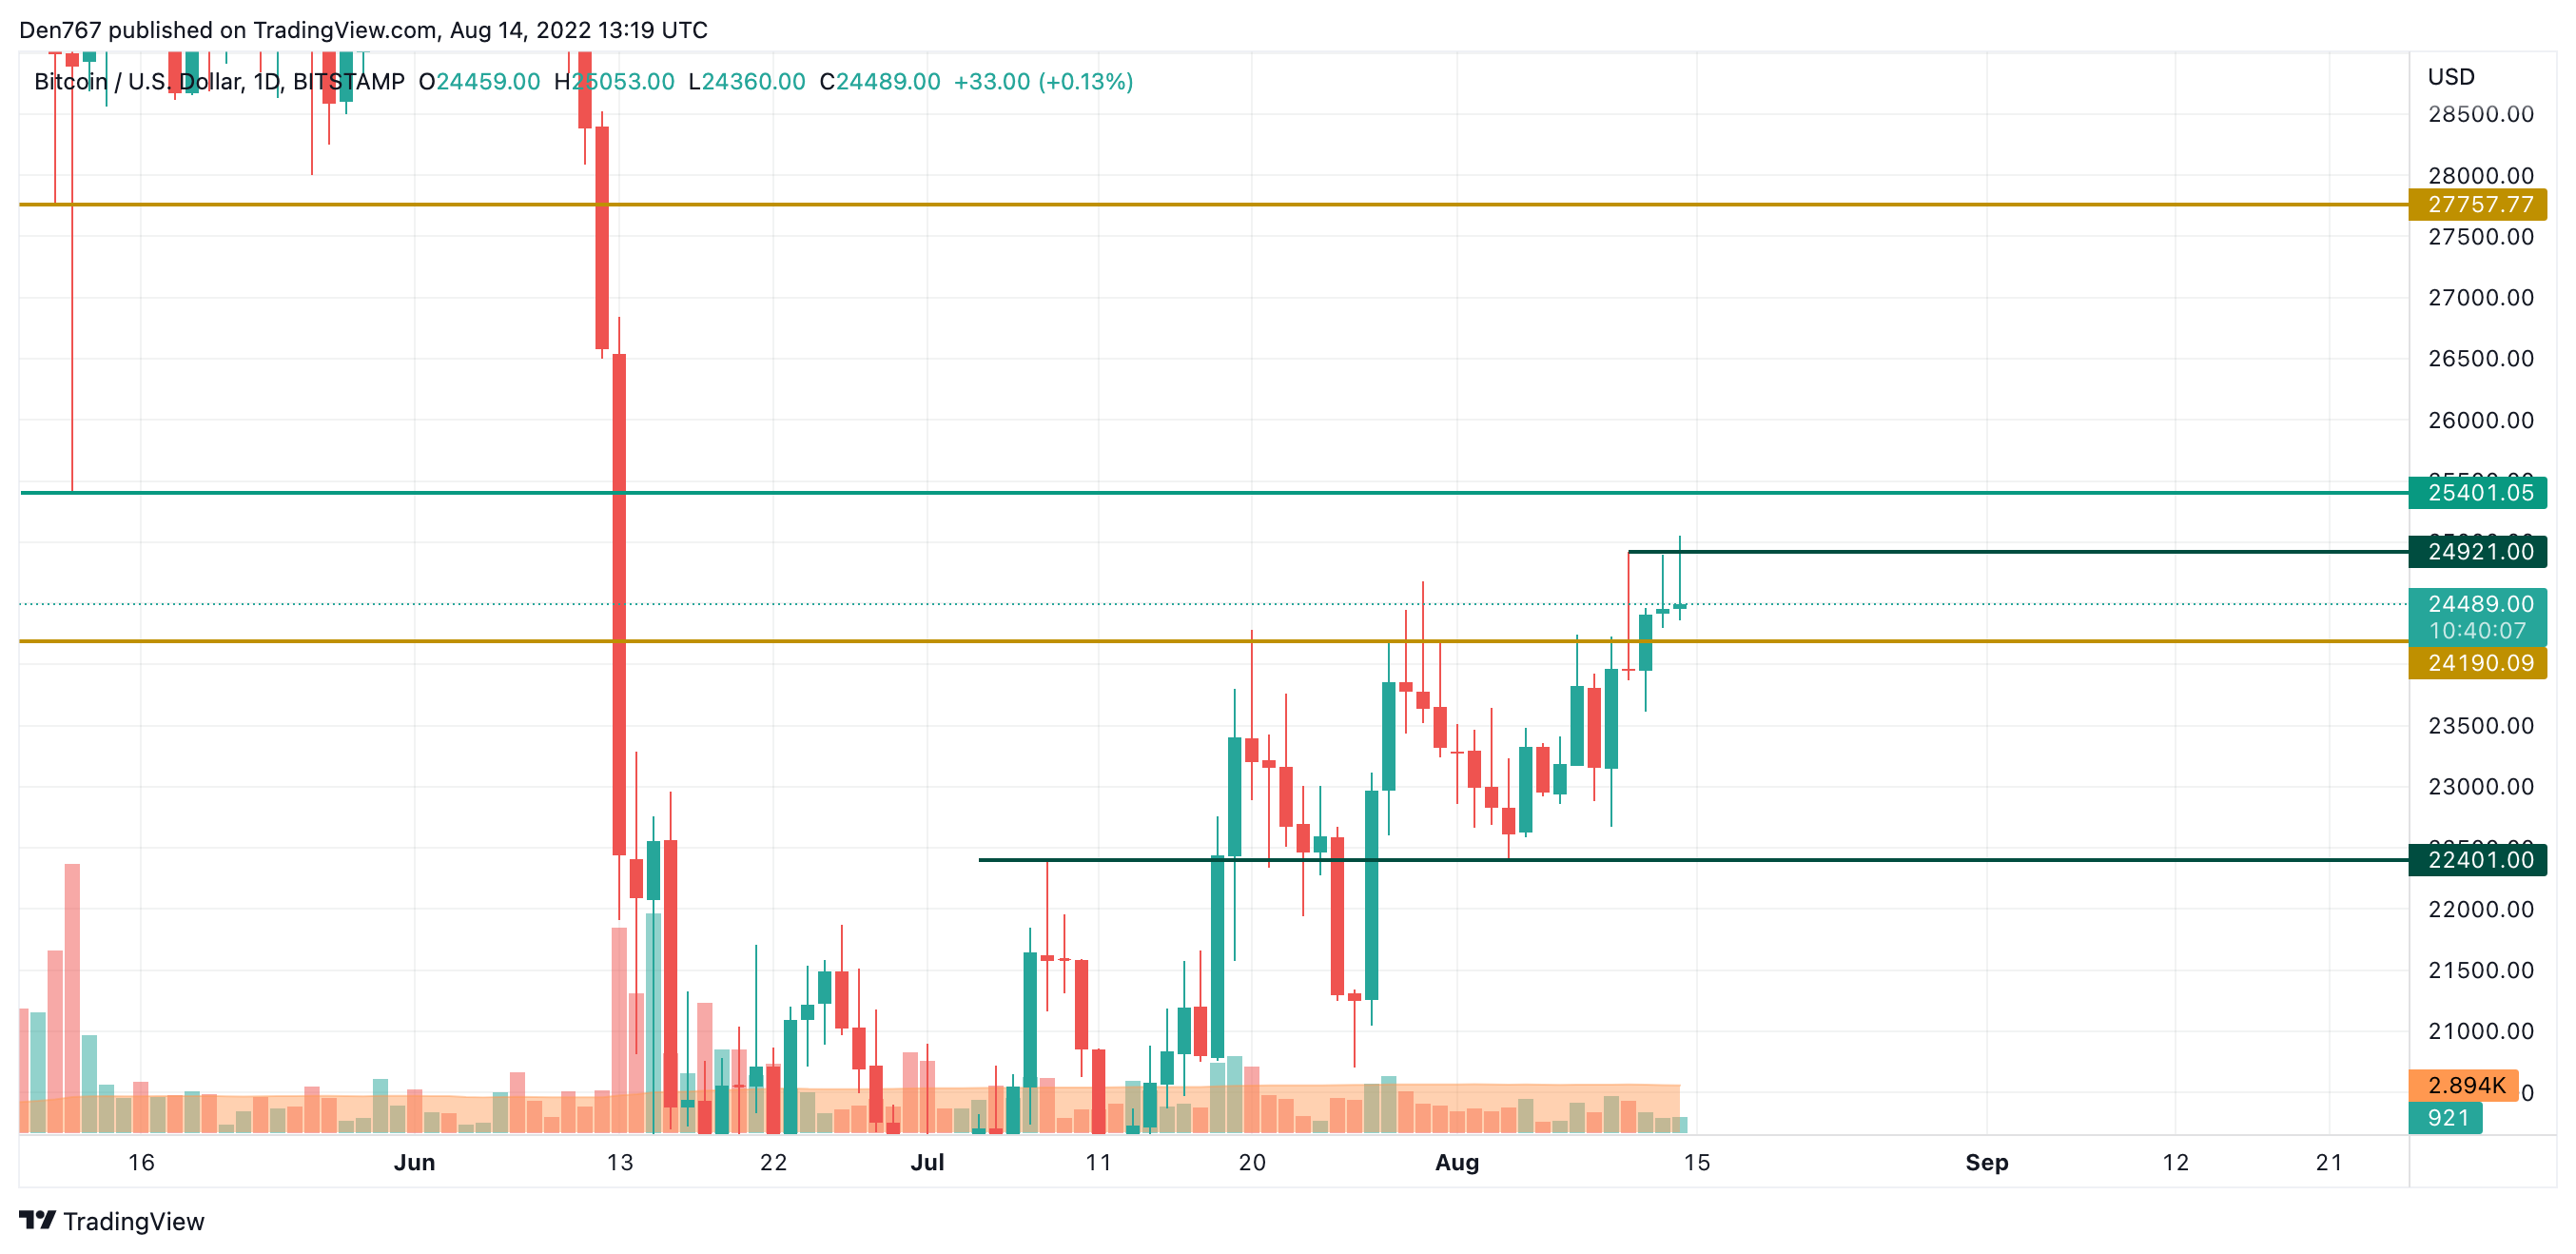
In the longer term, Bitcoin (BTC) has managed a false breakout above the almost formed resistance level at $24,921, which means the bulls are not yet ready to conquer the crucial $25,000 zone.
However, if the price stays above the $24,190 support, growth may occur soon.
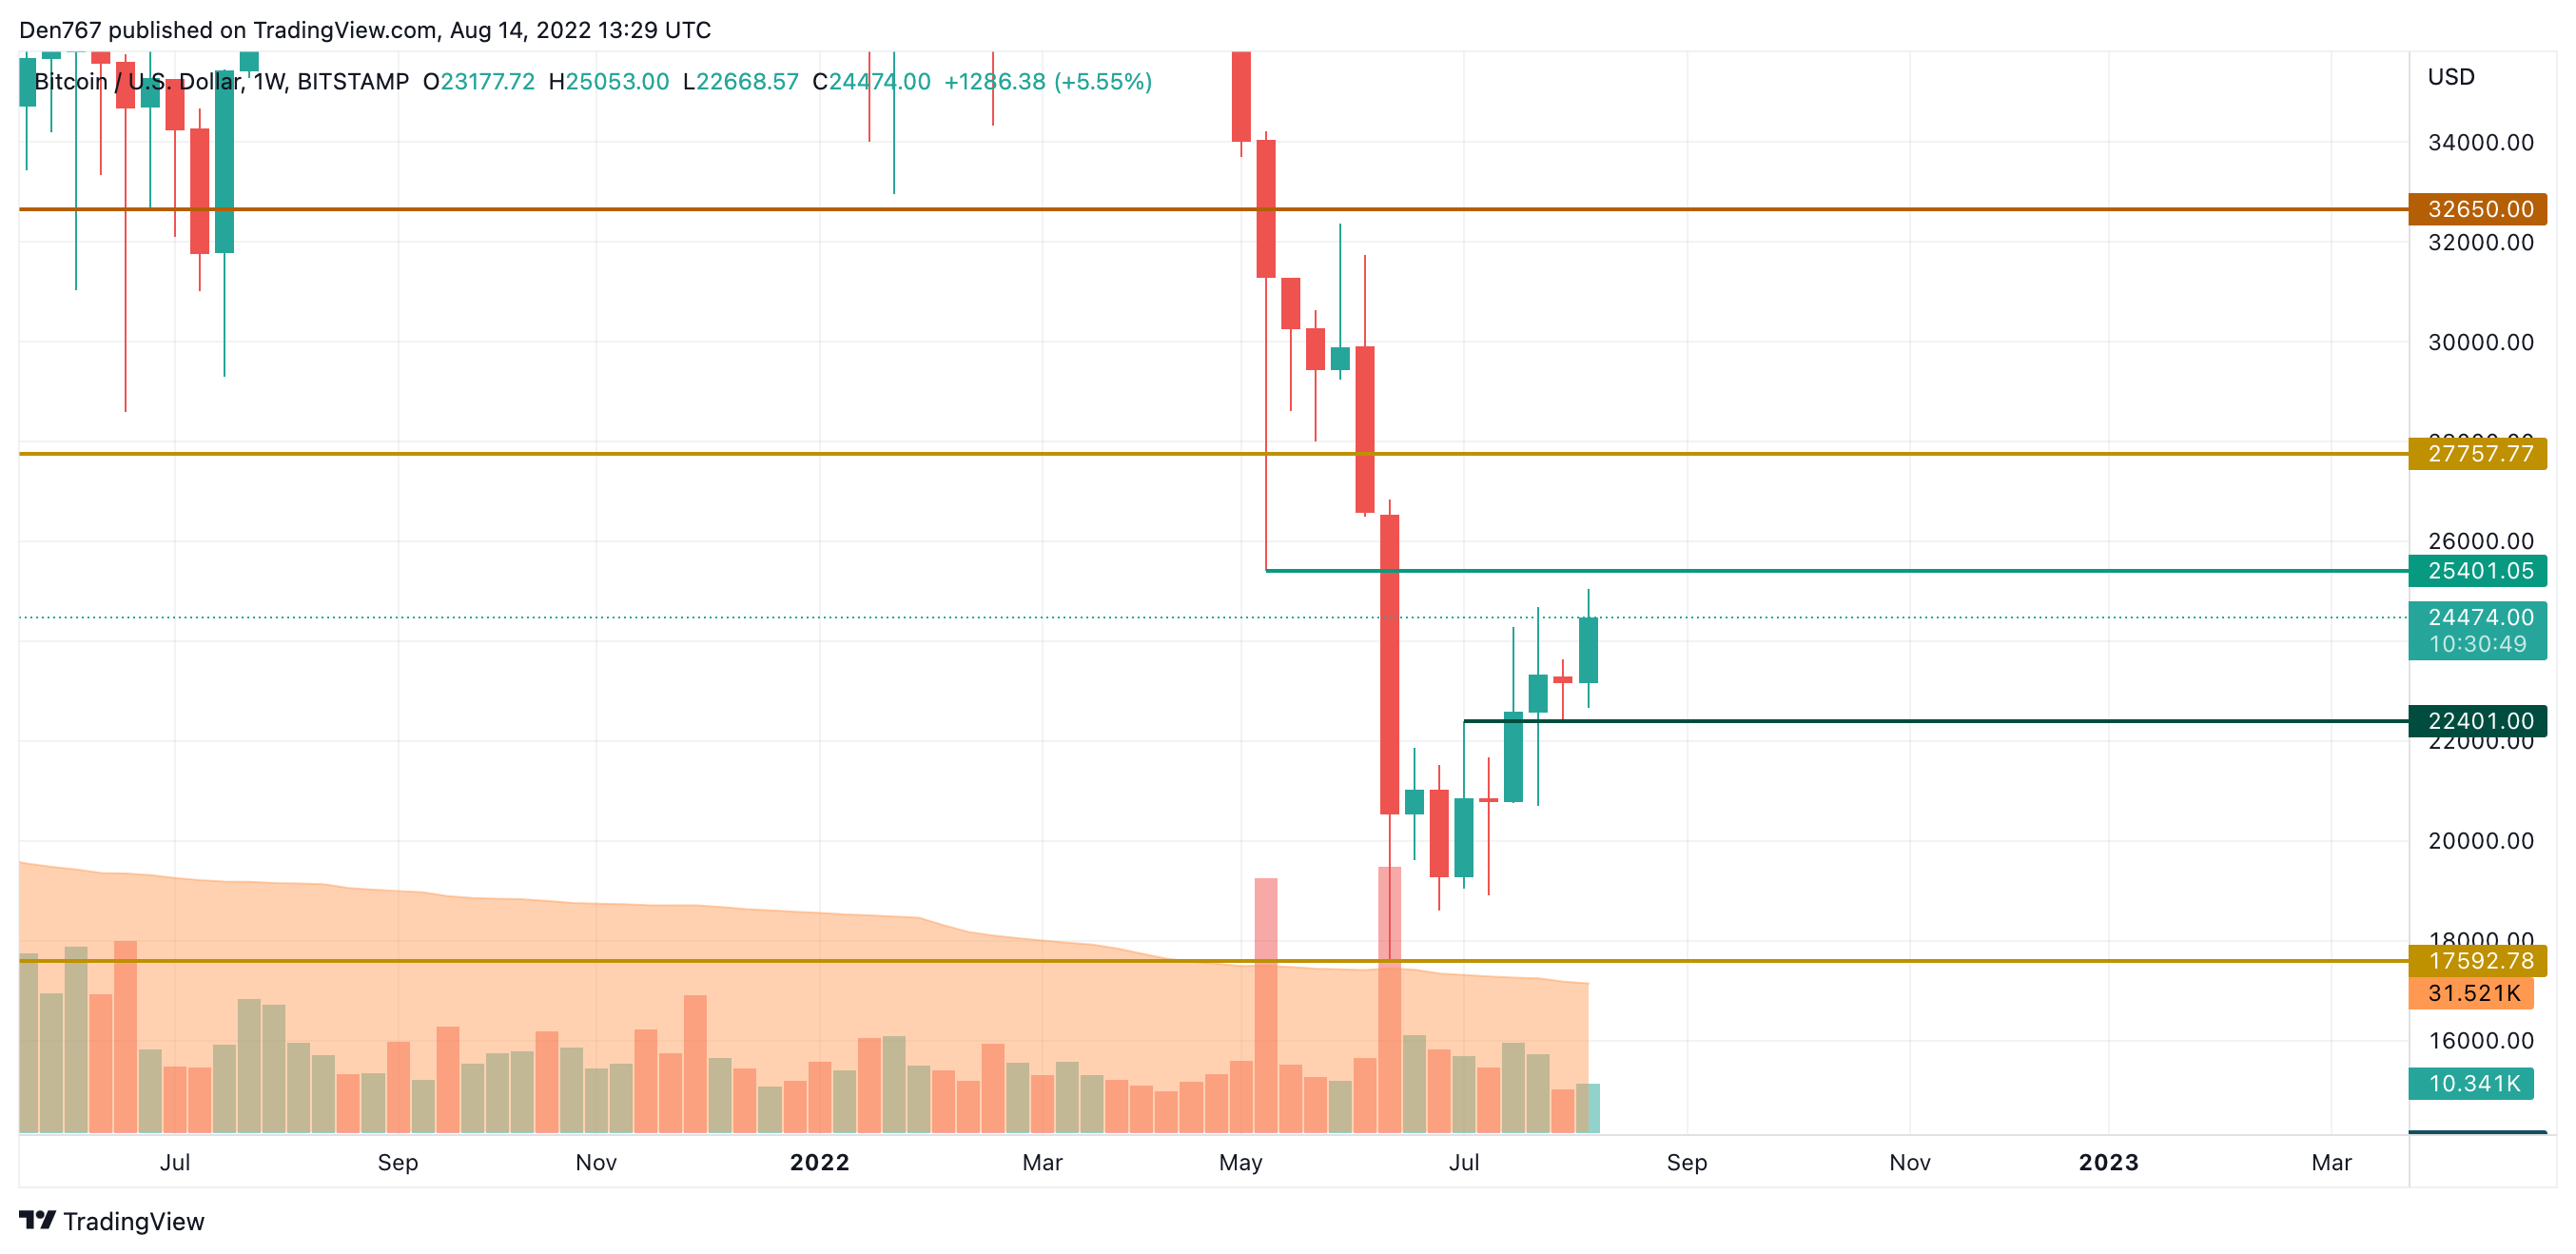
From a medium-term perspective, the major cryptocurrency is on the verge of a bullish close on the weekly candle, confirming the presence of buyers. In this case, the more likely scenario is a test of the mirror level at $25,400 by the end of the current month.
Bitcoin is trading at $24,448 at press time.
Learn Crypto Trading, Yield Farms, Income strategies and more at CrytoAnswers
https://nov.link/cryptoanswers
Comments are closed.