


- Ripple’s bearish momentum continues
- A descending triangle suggests a decline to $0.4
- A head and shoulders pattern paints a bleak picture for Ripple
There is no respite from the bearish momentum in the cryptocurrency market. Unless you are invested in Bitcoin, the pain of being long on another coin is enormous.
Take Ripple (XRP/USD) for example.
After rising to nearly $1 over the summer, it quickly gave back its gains. Essentially, it’s a classic pump-and-dump pricing promotion that’s enough to attract latecomers to the party, but then their investment quickly disappears.
The recent price movement is more problematic. There is no sign that the downward pressure will ease any time soon.
On the contrary, the market appears to be forming a bearish continuation pattern – a descending triangle.
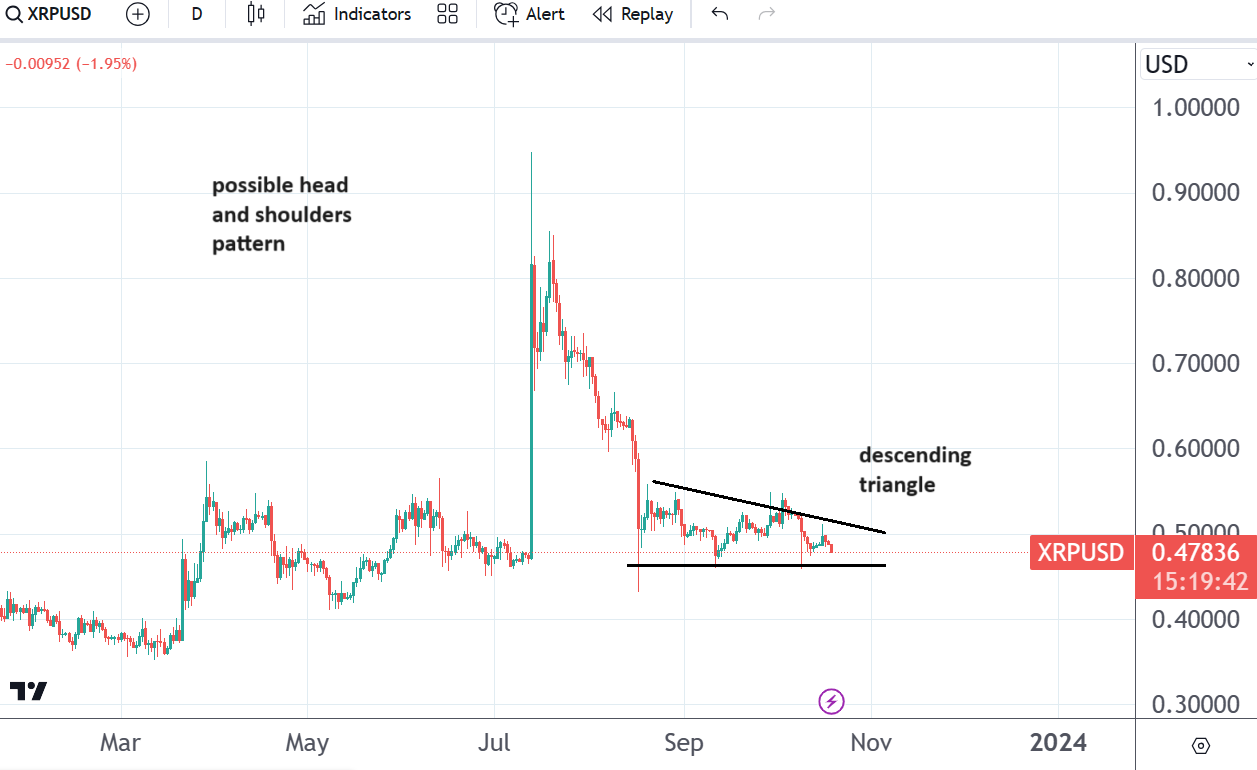
Ripple chart from TradingView
The descending triangle suggests a quick move to $0.5
As a bearish continuation pattern, a descending triangle indicates further downward movement. Its measured movement corresponds to the length of the longest segment of the triangle – in this case, signaling a decline to $0.4.
The main feature of such a triangle is the fact that the jumps from the horizontal support become smaller and smaller until the support finally gives way.
On an even larger scale, the descending triangle could simply be the right shoulder of a head and shoulders pattern. If this is the case, the rise during the summer months near the $1 area would be the top of the pattern.
If a head and shoulders pattern does indeed occur, Ripple has a lot more room to move down than bullish investors now want to assume.
Comments are closed.