


The index has rallied from a double bottom formation that began in 2008, and nothing has slowed the king dollar for nearly 14 years.
The latest feat in the U.S. dollar makes the financial markets nervous. After all, Forex is the largest market in the world.
Today we take a look at a long-term quarterly chart of the US Dollar Index and share an important takeaway for investors to watch out for.
In the chart below, we take the highest-ever quarterly close and the lowest-ever close to calculate some Fibonacci retracement levels. As you know, we are very tuned into applied Fibonacci analysis.
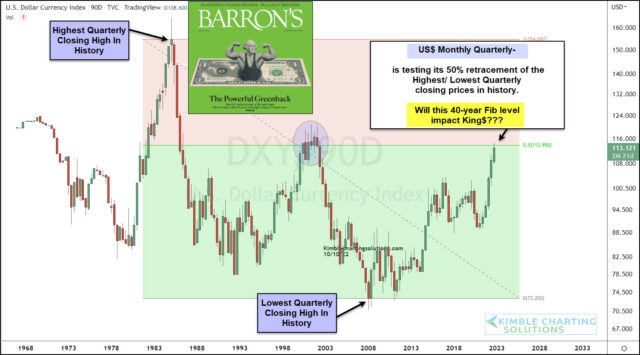
US dollar quarterly chart
And what do you know King Dollar is currently testing the 50% Fibonacci retracement level. A sharp move above this level would continue to worry markets and give the US dollar some room to rally higher, while a move lower (or consolidation) could serve to calm markets.
Make no mistake what King Dollar does from here should have a huge impact on the markets. Look at the 40 year Fibonacci level. And stay tuned.
Comments are closed.