

XRP price is up 7% in the last 24 hours, making the technical outlook for the coin bullish. Over the past week, XRP price hadn’t performed too well, but it has recouped its weekly loss with the recent price surge.
Currently XRP has lost only 2% of its market value in the last week.
Although most altcoins tumbled under the bearish influence, XRP has managed to show positive sentiments on its daily chart. Buyers appeared to have gained confidence in the asset.
The technical outlook is also turning towards bullish signals at the time of writing. After registering selling strength over the past few weeks, XRP is now trading with increased buying power.
Bitcoin price action is still taking a toll on XRP price action.
At current price levels, XRP is still trading 89% below its all-time high of $3.40. The global cryptocurrency market cap today is $1 trillion, with a 0.1% negative change in the last 24 hours.
XRP Price Analysis: One-Day Chart
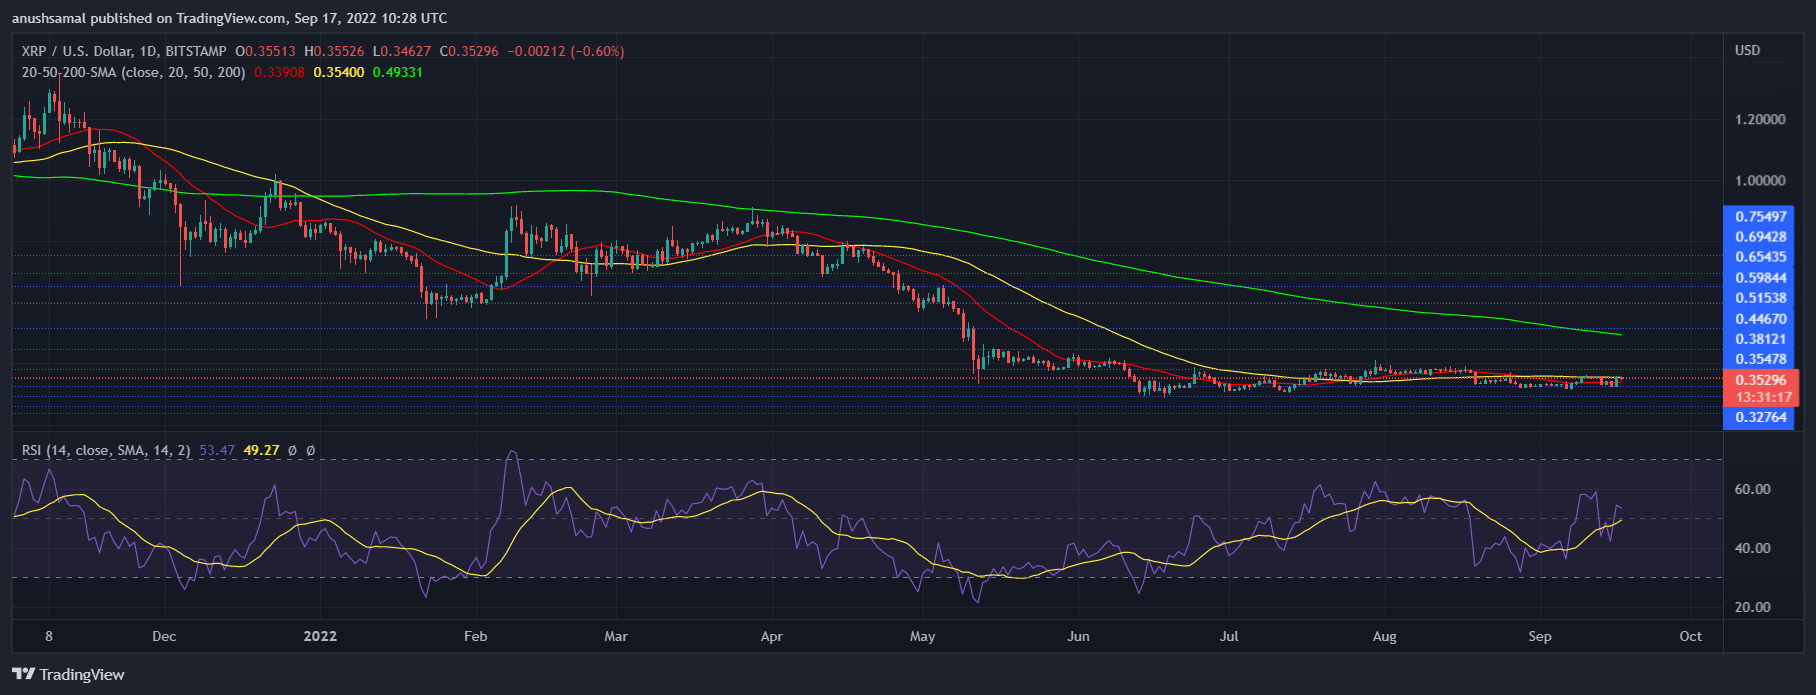
XRP was priced at $0.35 on the one-day chart | Source: XRPUSD on TradingView
The altcoin is trading at $0.35 at the time of writing. Tight resistance awaits XRP at $0.38 as the altcoin has struggled at this price level for a significantly longer period.
Once XRP surges above the above resistance, the altcoin might have a chance to revisit the $0.44 level. On the other hand, the support for the coin was at $0.33.
Right now, XRP price is trading pretty close to this level. The amount of XRP traded in the last trading session decreased which could be a sign that the number of buyers may have decreased at the time of writing.
Technical Analysis
 XRP showed positive buying power on the one-day chart | Source: XRPUSD on TradingView
At the time of writing, buyers appear to have helped XRP drive prices higher. Technical indicators also suggested that purchasing power helped the altcoin recover.
The Relative Strength Index was above the half line, meaning the buyers were taking over the price action in the market.
However, the RSI has seen a small tick down, which could mean that the number of existing buyers has decreased.
XRP price also peeked through the 20 SMA line, showing that there was demand for the coin and that buyers are driving the price momentum in the market.
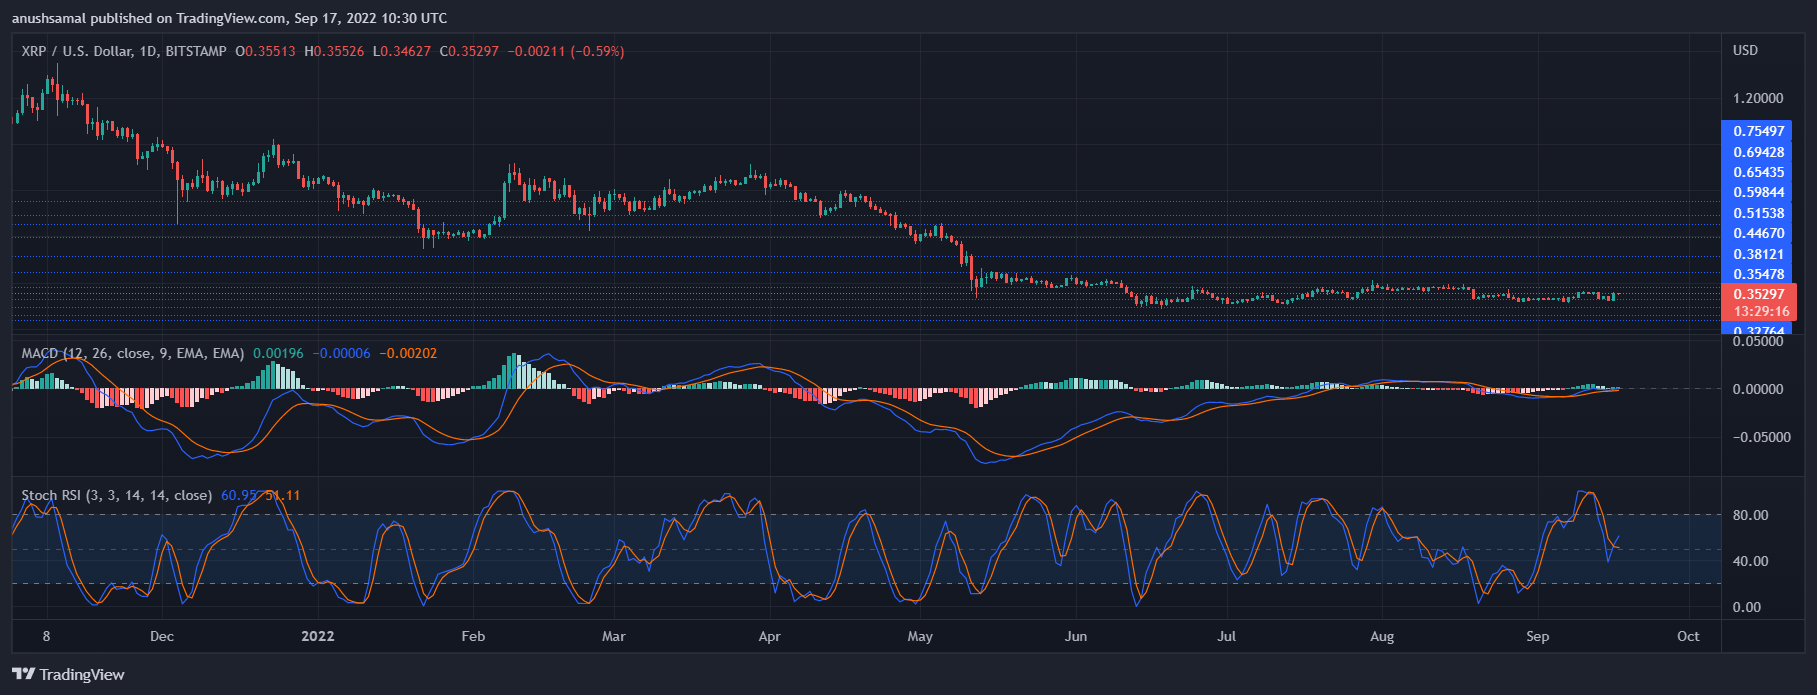 XRP registered buy-signal on the one-day chart | Source: XRPUSD on TradingView
Buyers have reacted to XRP’s buy signal on the daily chart as shown on its indicator.
The Moving Average Convergence Divergence underwent a bullish crossover and showed green signal bars that were buy signals for XRP.
The MACD indicates the price momentum and direction of the asset. The Stochastic RSI also reads market momentum. The indicator was seen above its midline, meaning the asset was trending higher.
Learn Crypto Trading, Yield Farms, Income strategies and more at CrytoAnswers
https://nov.link/cryptoanswers
Comments are closed.