


Bitcoin (BTC) has started March well, establishing its price above the $60,000 support zone and reaching its highest monthly close since October 2021, just before hitting an all-time high.
In fact, the current positive momentum is supported by several bullish elements, including the upcoming halving and continued exchange-traded fund (ETF) performance. Accordingly, significant market consensus suggests that the rally is likely to continue its upward trend.
Crypto trading expert Trading Shot commented on what to expect from Bitcoin in a March 2 TradingView post, emphasizing that based on technical indicators and historical patterns, Bitcoin is close to reaching a new all-time high before the next halving.
After Bitcoin broke the 0.382 Fibonacci level on the weekly chart in early February for the first time since June 6, 2022, the expert noted that the development was cyclically crucial and drew parallels to previous cycles.
Bitcoin price analysis chart. Source: TradingView
Trading Shot applied the Fibonacci channel to the last two cycles and noted that every time Bitcoin crossed the 0.382 Fibonacci level in the past cycle, it also reached the 0.5 Fibonacci level. This observation is significant because it has already occurred twice.
Notably, in these cases, Bitcoin took seven weeks (49 days) and eight weeks (56 days) to reach the 0.5 Fib level after breaking through the 0.382 Fib level.
Based on this historical pattern, the analyst estimated that it will take a maximum of eight weeks for Bitcoin to reach the 0.5 Fib level again. If this pattern repeats exactly, the target week would be April 1, 2024. In such a scenario, Bitcoin could reach $81,000. However, if the breakout occurs sooner, the range could be between $78,000 and $81,000.
The market is ready for a parabolic rally
At the same time, given the prevailing bullish sentiment in the market, Trading Shot suggested that the cryptocurrency market may be entering the most aggressive phase of the current cycle.
“The 1W CCI indicator (green circles) suggests we may be closer to a November 2020 fractal than May-June 2019 (which was of course caused by the Libra euphoria). “This suggests that we may currently be at the very beginning of the most aggressive part of this cycle, the Parabolic Rally,” he said.
Notably, Bitcoin's current price coincides with what appears to be significant demand for the product's ETF, with investors increasingly betting on BTC reclaiming its record high of $69,000. On March 1, cumulative spot Bitcoin ETF volume reached an all-time high of $73.91 billion after weeks of consistent gains.
The potential impact of the ETF saw Bitcoin briefly reach $64,000 before falling slightly below $62,000.
Bitcoin price analysis
At press time, Bitcoin is valued at $61,769, with a daily increase of almost 1%. In the last seven days, Bitcoin is up 20%.
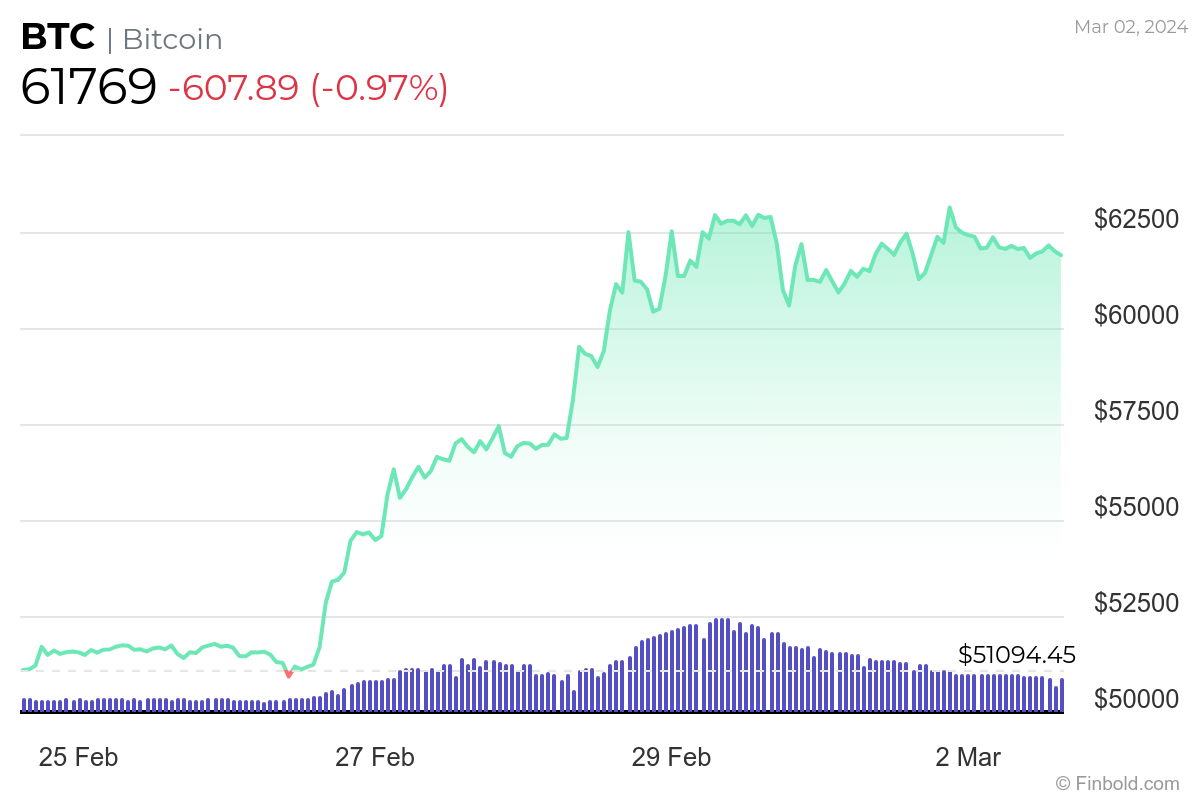
Although the majority consensus points to continued Bitcoin gains, caution is advised as the asset is likely to undergo a correction, especially in the event of increased profit-taking.
Disclaimer: The content of this website should not be considered investment advice. Investing is speculative. When you invest, your capital is at risk.
Learn Crypto Trading, Yield Farms, Income strategies and more at CrytoAnswers
https://nov.link/cryptoanswers
Comments are closed.