


An analyst has revealed a simple strategy for buying and selling Bitcoin using the historical pattern followed by two BTC on-chain indicators.
These Bitcoin on-chain indicators have historically followed a certain pattern
In a post on X, CryptoQuant author Axel Adler Jr. discussed a simple strategy for timing buy and sell moves for Bitcoin. The strategy is based on the trend observed in the past in two BTC on-chain metrics: net unrealized loss (NUL) and net unrealized gain (NUP).
As the name suggests, these indicators track the total amount of unrealized losses and unrealized gains that investors are currently bearing.
These metrics work by going through the transaction history of every coin in circulation to see what price it was last traded at. Assuming that the last transfer of each coin was the last time it changed hands, the price at that time would serve as the current cost basis.
If the previous price for a coin was below the current spot price of the cryptocurrency, that coin is currently showing a profit. The NUP subtracts the two to calculate the exact unrealized profit for the coin.
The same applies to NUL for coins whose cost basis is greater than the current value of the asset. These indicators then sum this value for the entire supply and divide the sum by the current market capitalization.
First, here is a chart shared by NUL analyst that shows a pattern the metric has followed throughout Bitcoin's history:
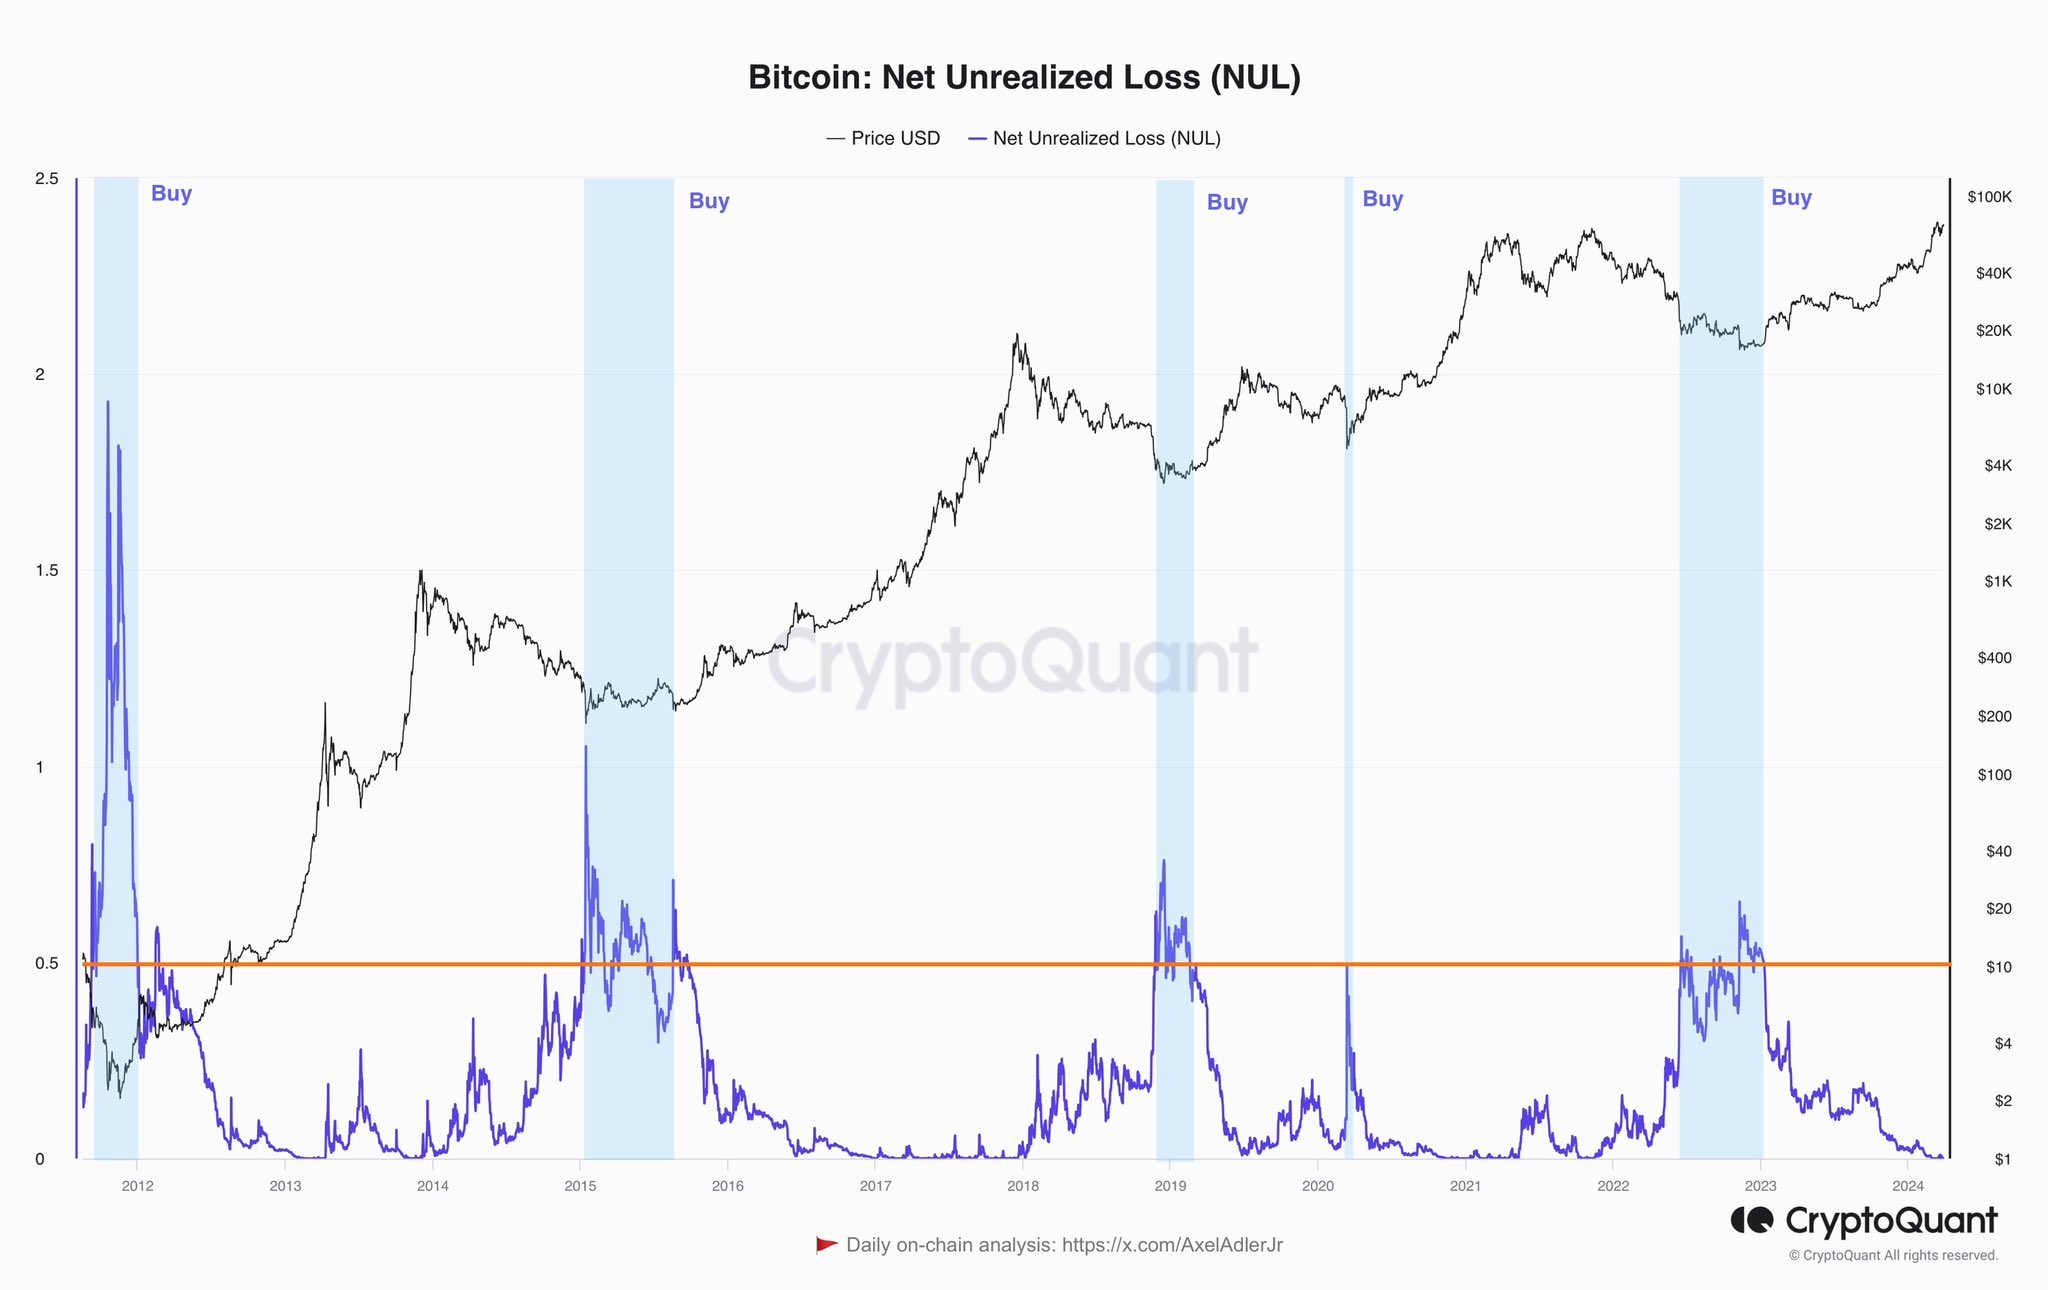
The value of the metric appears to be declining in recent days | Source: @AxelAdlerJr on X
Bitcoin NUL appears to have exceeded 0.5 in the past when the asset's price traded around bear market lows. According to Axel, the indicator in this area would be the time to buy more.
Recently, the metric has been hovering around the zero mark, meaning investors had an unrealized loss. This makes sense as the cryptocurrency has reached new all-time highs (ATHs). Of course, 100% of the supply goes into profit when an ATH is set.
Similar to the NUL pattern, NUP has been above the 0.7 level at key highs in the past, suggesting that it could be a good opportunity to sell when the indicator is in this area.

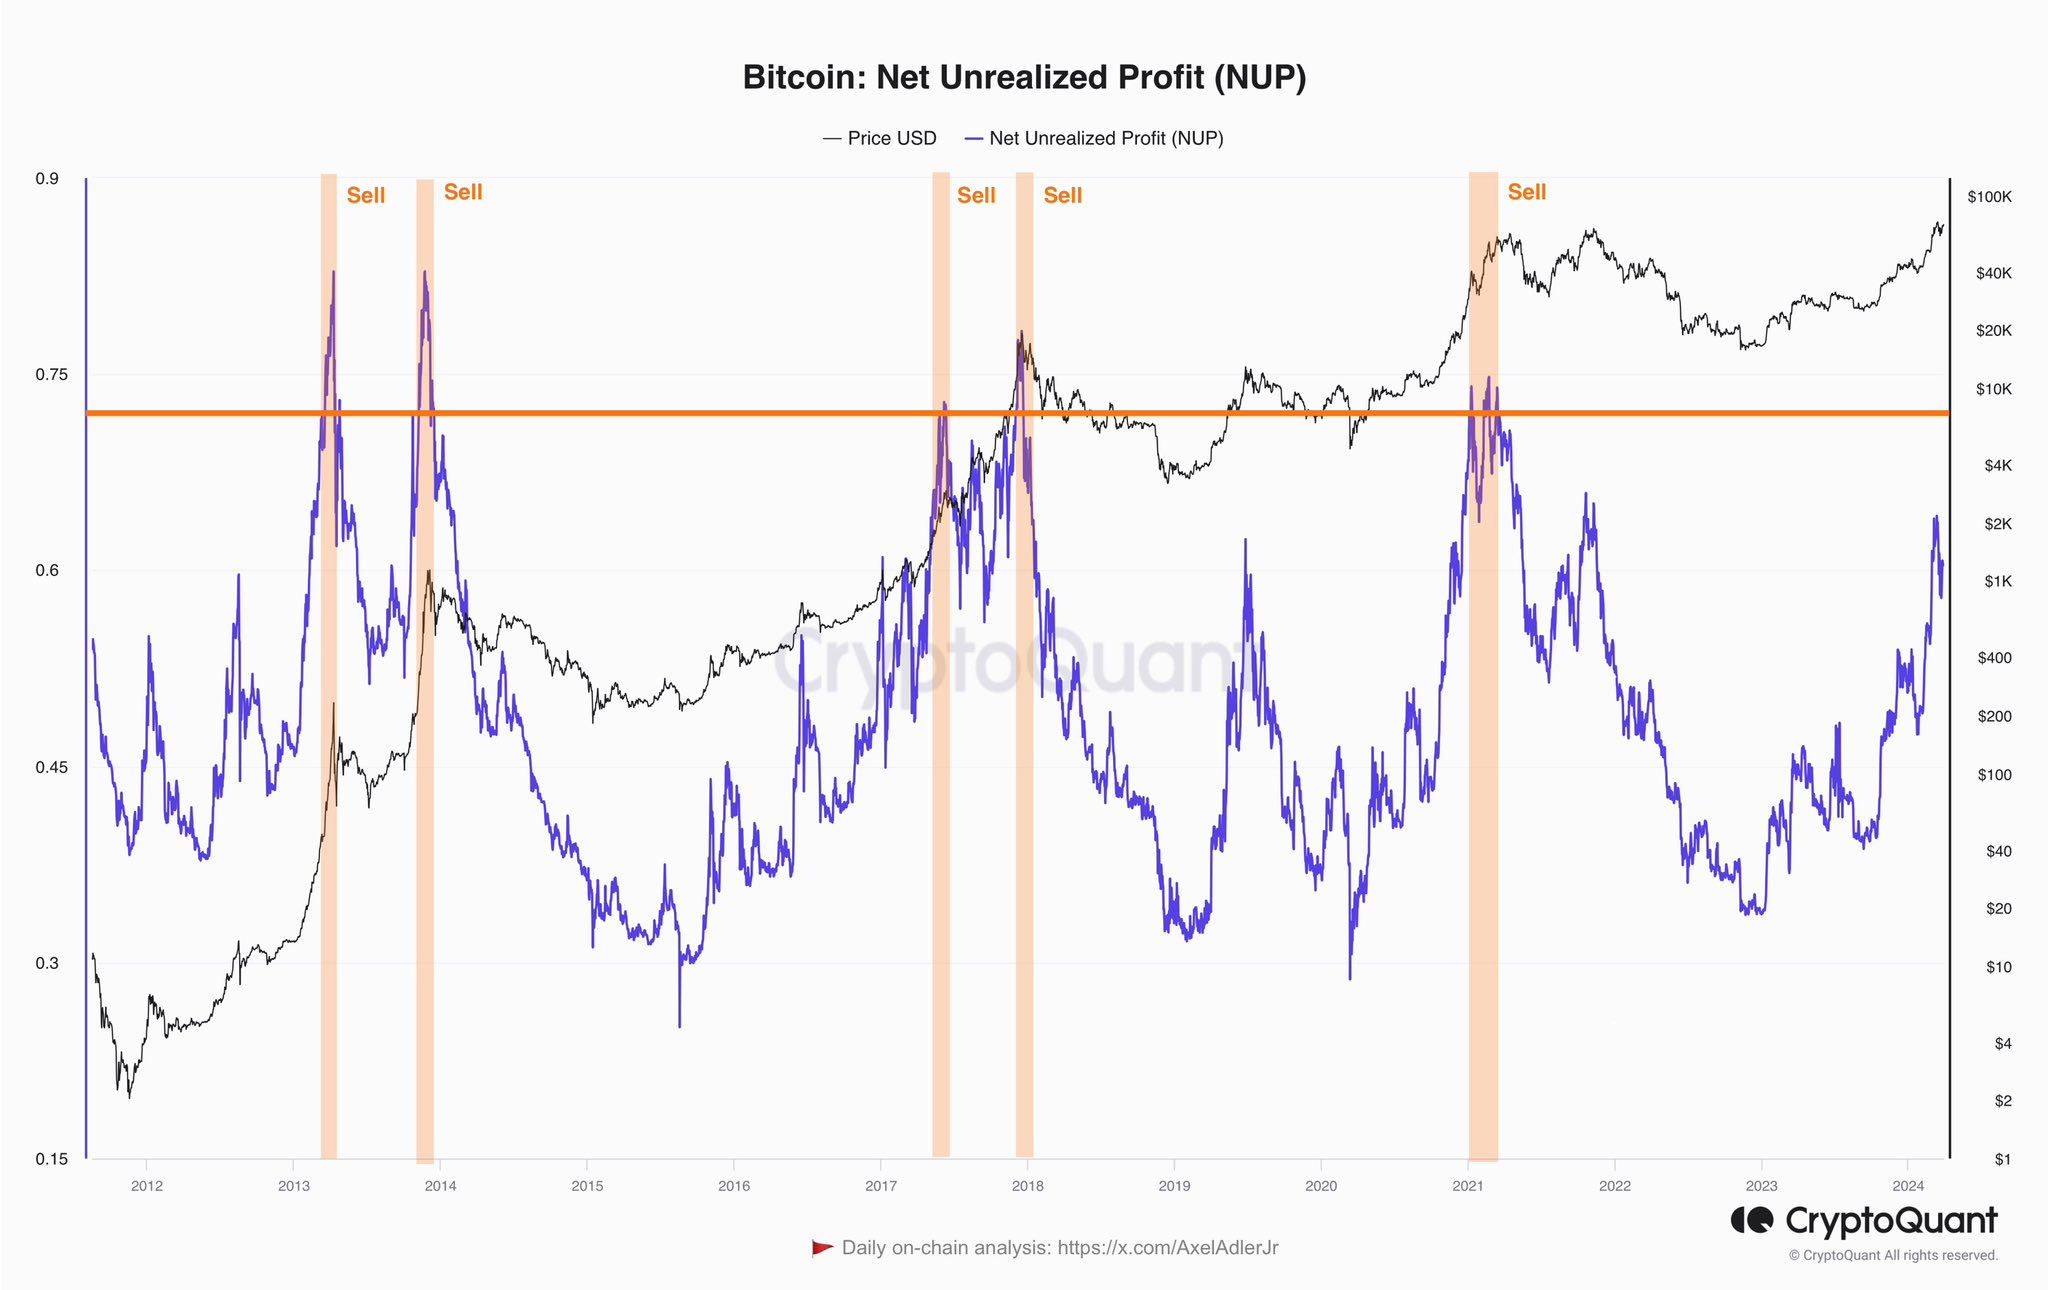
It looks like the value of the indicator has increased recently | Source: @AxelAdlerJr on X
As can be seen from the chart, NUP has risen with the recent Bitcoin rally. However, so far the indicator has not risen above the seemingly important 0.7 level, suggesting that the market may not yet be at an overheated point where selling would be ideal, at least according to this strategy.
However, the graphs of the two indicators show that neither of them shows the exact highs or lows of the asset. This is particularly clear in the NUP data, where the indicator signaled “sell” during peaks that were only in the middle of the bull market.
However, in the past it would have been profitable to buy during the points marked by the NUL and then sell at the overheated NUP levels. In this sense, this would actually be a “simple” strategy for the asset.
However, it remains to be seen whether these patterns will continue in the current Bitcoin cycle.
BTC price
At the time of writing, Bitcoin is trading at around $69,400, down 2% in the last 24 hours.

The asset's price seems to be moving sideways recently | Source: BTCUSD on TradingView
Featured image by Kanchanara on Unsplash.com, CryptoQuant.com, Chart from TradingView.com
Learn Crypto Trading, Yield Farms, Income strategies and more at CrytoAnswers
https://nov.link/cryptoanswers
Comments are closed.