


Uniswap has been showing tight trading conditions for the past 24 hours. The coin has been consolidating, posting minor losses over the last day. Although Uniswap has performed well over the past week, gaining more than 30%, the bulls seem to be resting lately.
UNI recently broke above $6.00 and may now be targeting the $8.00 price cap. Purchasing power showed a slight decline, but there were still more buyers than sellers in the market. Bitcoin’s price action has helped many altcoins rally, but continued support from buyers remains crucial.
However, looking at the technical indicators, it seems that UNI might be floating in the same price zone at least in the coming trading sessions. After the rally, the possibility of a pullback cannot be ruled out. Currently, UNI has not seen a pullback, but consistent consolidation could pull the coin to the next support level.
If it manages to clear its immediate resistance, there are chances for UNI to trade above the $8.00 price level.
Uniswap price analysis: four hour chart
Uniswap was priced at $7.41 on the four-hour chart | Source: UNIUSD on TradingView
UNI was trading at $7.41 at press time and the coin is still bullish on its chart. The current consolidation range was between $7.33 and $7.49 respectively. A slight nudge from buyers could help Uniswap surpass the $7.57 resistance level.
In that case, reaching $8.00 becomes easy and there are chances of UNI trading above $8.00 level. On the upside, local support for the coin was $7.08 and then $6.47. A break below $6.47 will push Uniswap near $5.38. UNI’s traded volume declined slightly, suggesting a modest decrease in buying pressure.
Technical Analysis
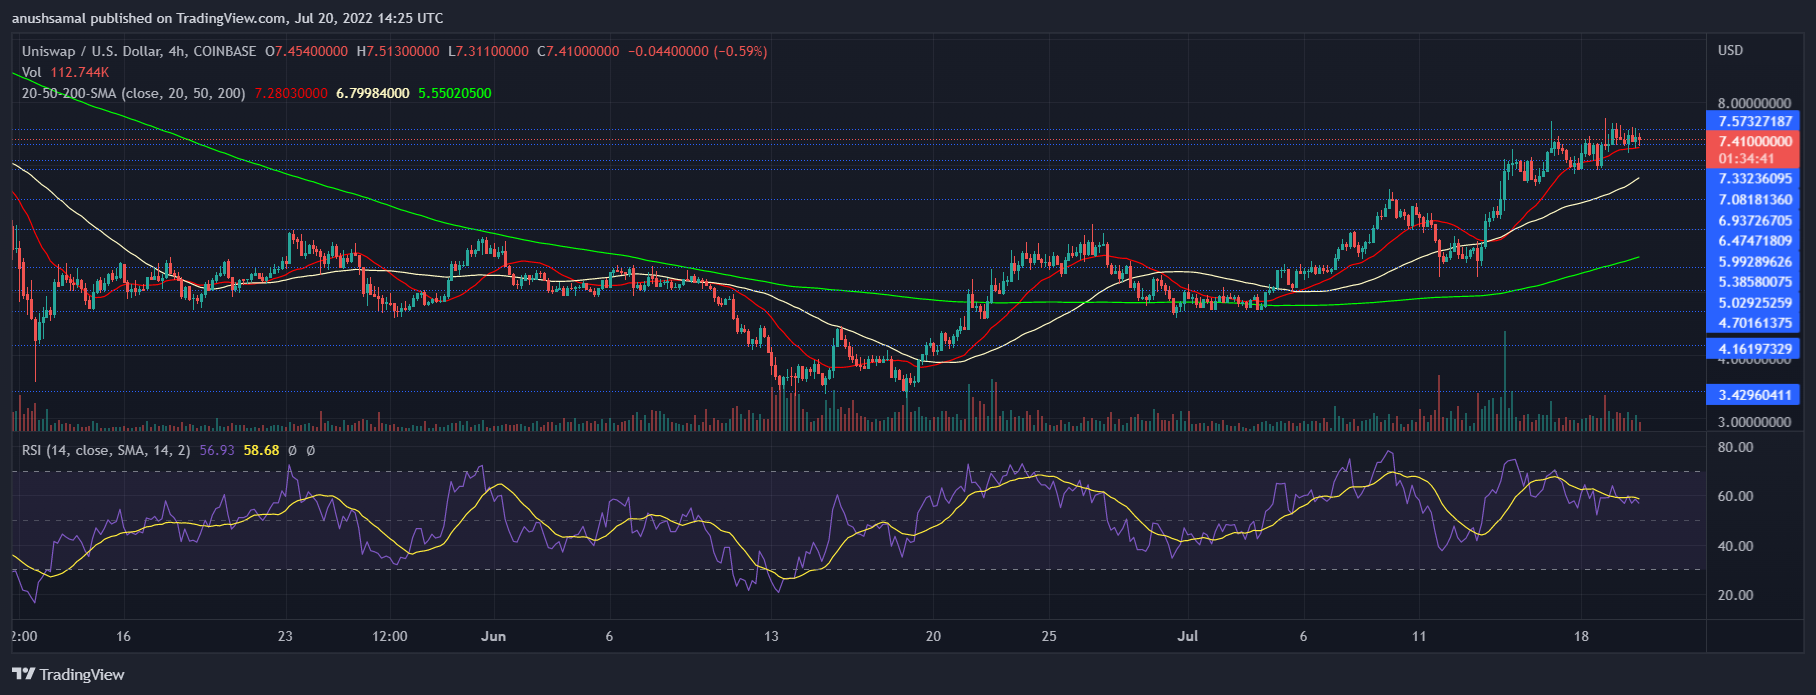 Uniswap saw a small downtrend in the number of buyers | Source: UNIUSD on TradingView
UNI has seen growing buying power on the chart since the coin’s rally. There is a small downward trend in the number of buyers, even though the buyers are still in control of the market. The Relative Strength Index was above the half line, meaning buying pressure was outstripping selling pressure.
UNI’s price also traded above the 20-SMA line, signaling that the buyers are driving the price momentum in the market. UNI was also above the 50-SMA and 200-SMA, meaning the coin was trading with bullish momentum.
Related Reading | Bitcoin Races To $24,000 As Miners Pull $300M From Wallet
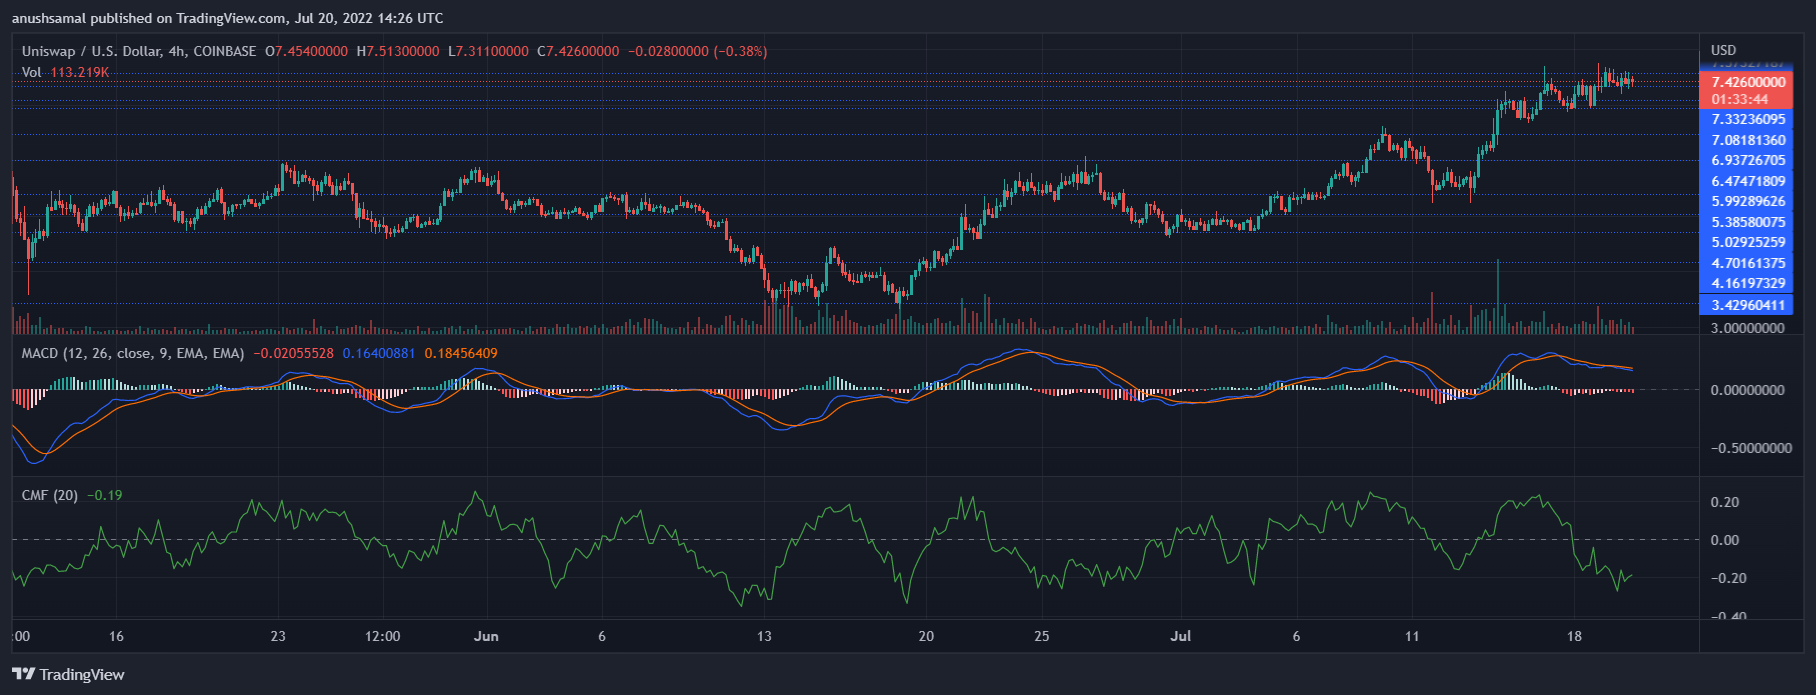 Uniswap is seen falling in capital inflows | Source: UNIUSD on TradingView
UNI was positive on purchasing power, however some indicators suggested otherwise. Chaikin Money Flow determines the capital inflows and outflows of the asset. Chaikin Money Flow was below the half line and that meant a drop in capital inflows. Moving Average Convergence Divergence represents price dynamics and a change in price trend.
MACD underwent a bearish crossover and red histograms were seen below the half line. This reading is associated with a change in the current price direction in the coming trading sessions and also with a sell signal. If Uniswap needs to remain in the bullish zone, buyers need to be present along with support from the broader market.
Related Reading | Bitcoin dominance falls as Ethereum takes up more space
Featured image by Forbes India, chart by TradingView.com
Learn Crypto Trading, Yield Farms, Income strategies and more at CrytoAnswers
https://nov.link/cryptoanswers
Comments are closed.