


An analyst has stated that an indicator that has been holding for Bitcoin since December is now giving a sell signal for the cryptocurrency.
TD Sequential is currently providing a sell signal on the daily Bitcoin chart
In a new post on X, analyst Ali discussed the formation of a TD Sequential sell signal on the Bitcoin daily price chart. The “Tom Demark (TD) Sequential” is an indicator in technical analysis used to locate likely highs and lows in the price of an asset.
The TD Sequential consists of two phases. The first is called “Setup” and lasts nine candles. Once there are nine candles (of the same polarity), the setup is complete and the indicator signals a likely price reversal.
Of course, the direction of such a reversal depends on the type of candles that formed the setup. If these candles were green, the indicator would indicate a high for the asset, while red candles would indicate a low.
When setup is complete, the “Countdown” phase begins. In this phase, candles of the same type are counted again, up to thirteen. Once the countdown is also over, it could be assumed that another possible price reversal has occurred.
Recently, Bitcoin completed a TD Sequential phase of the first kind. Here is the chart shared by the analyst that shows this pattern forming in the cryptocurrency's daily price:
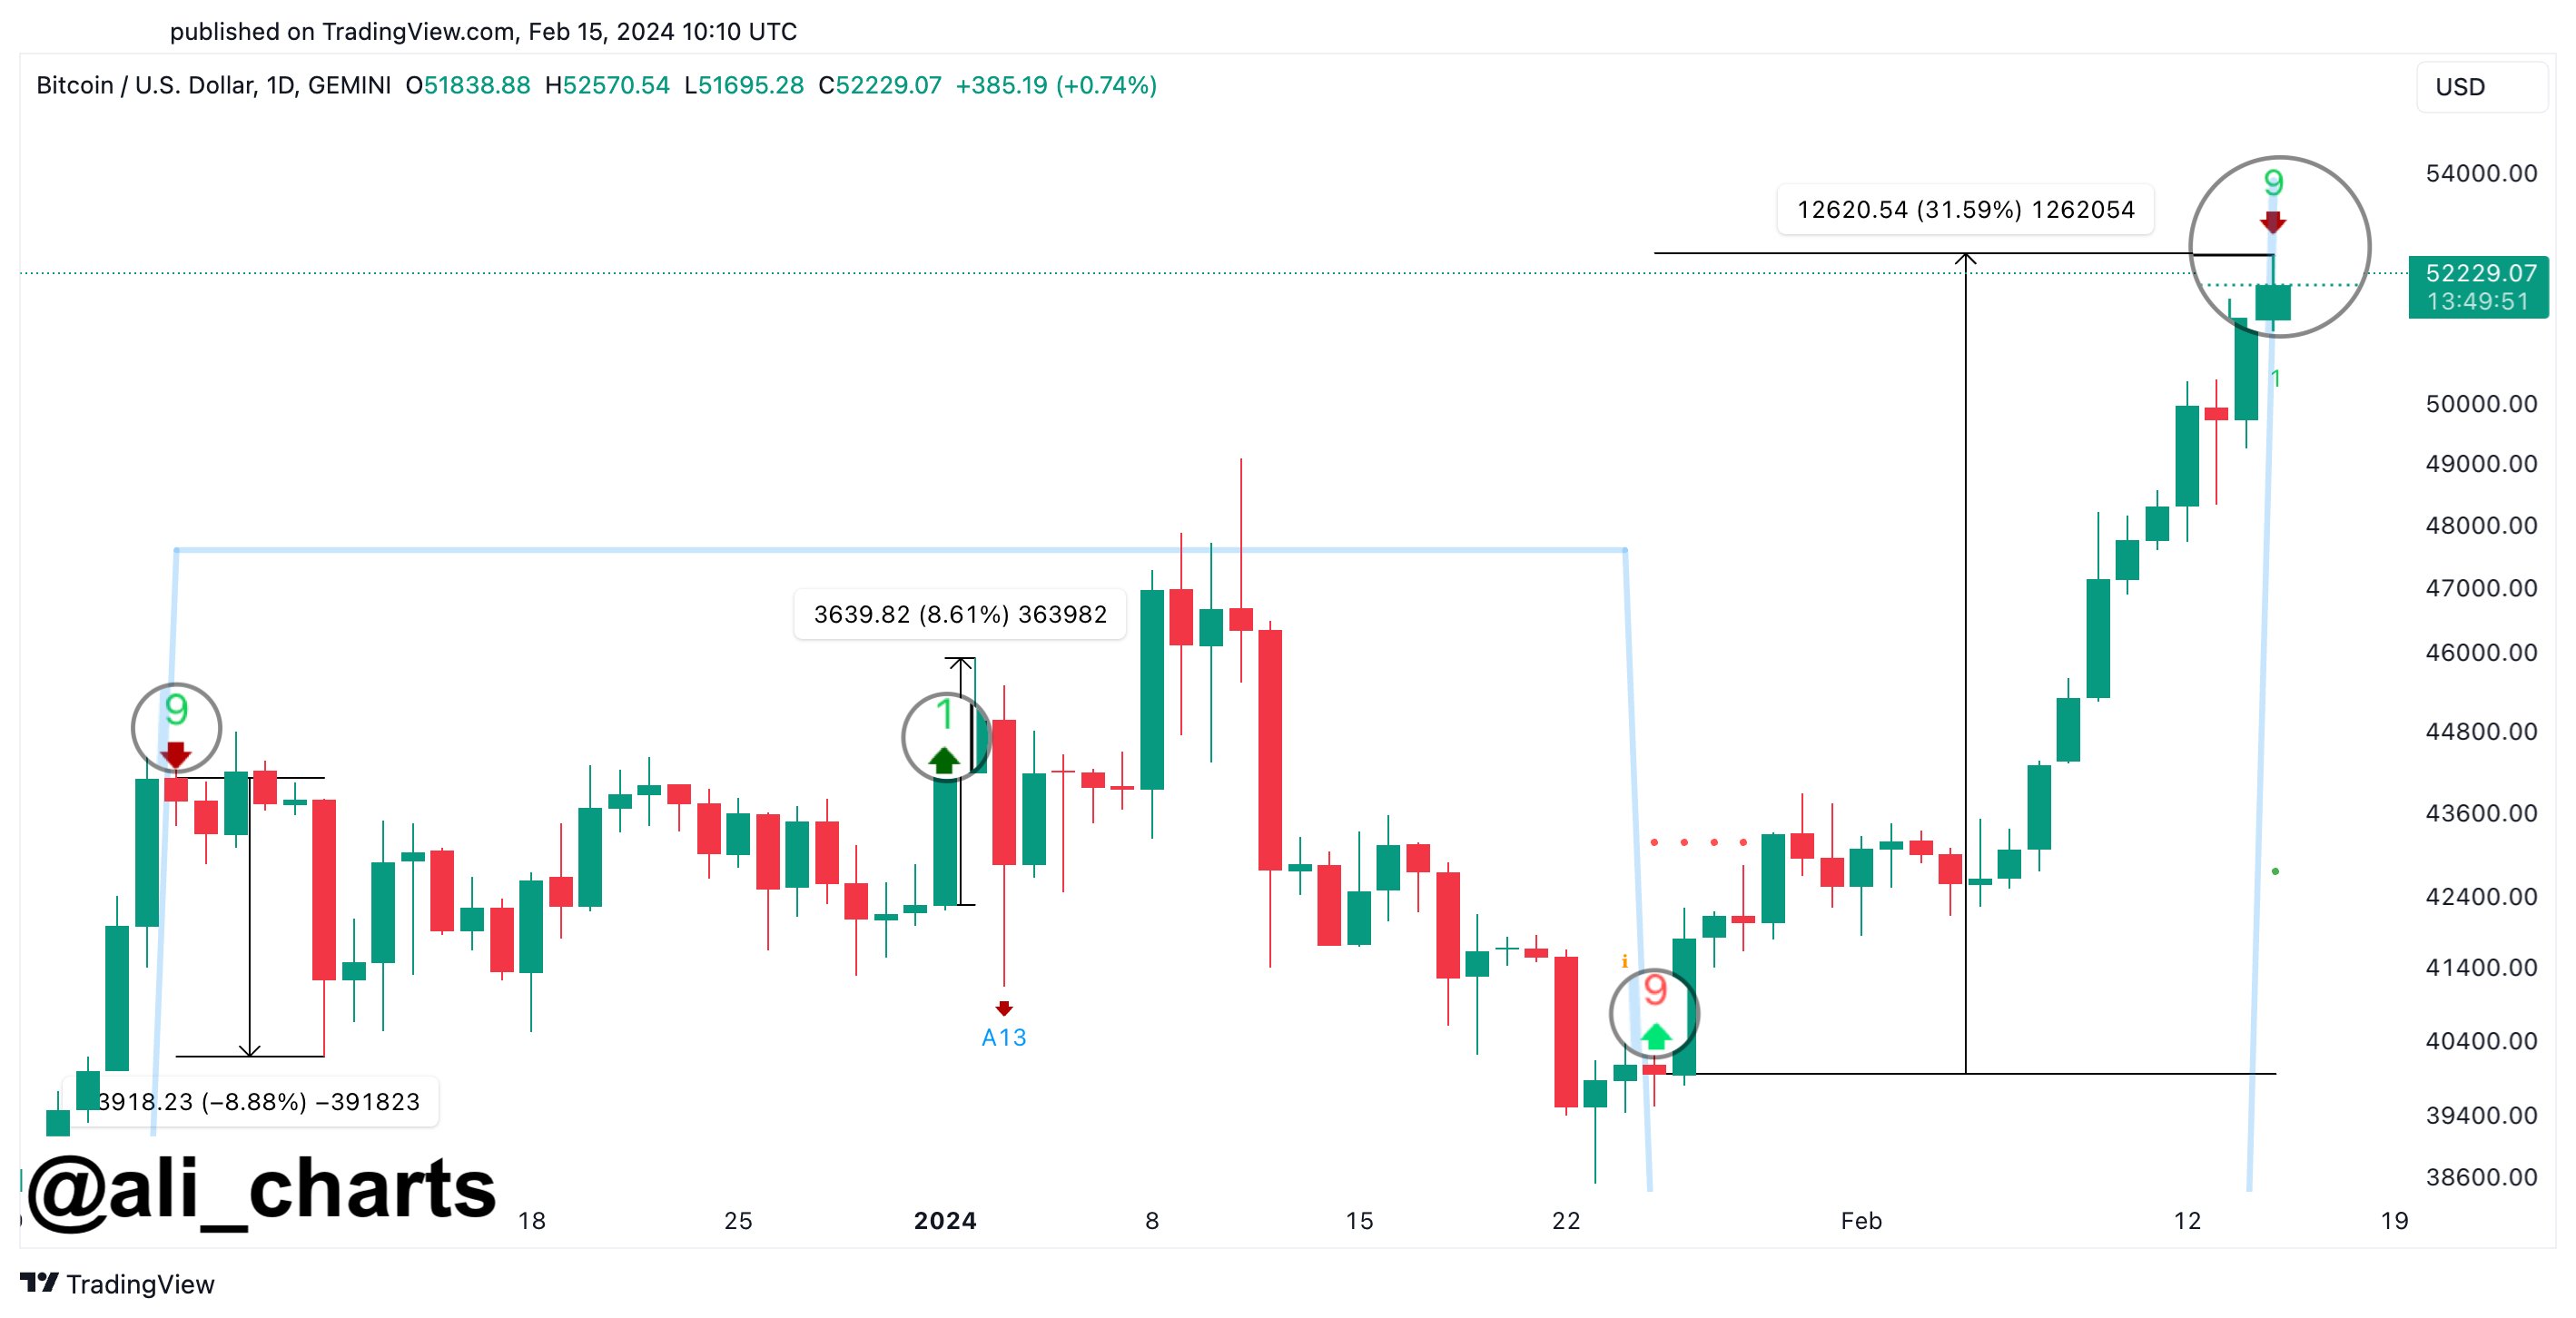
The TD Sequential setup currently available for BTC | was completed Source: @ali_charts on X
As can be seen in the chart, the TD Sequential setup recently completed with green candles for Bitcoin. These green candles have come for the coin as it has experienced strong bullish momentum that pushed its price above the $52,000 level.
The fact that the TD Sequential setup with green candles has formed suggests that the indicator may now provide a sell signal for the price of the cryptocurrency.
In the same chart, Ali highlighted the previous cases since December last year where a setup was completed for the asset. It appears that during this window, both TD Sequential's buy and sell signals were held for the coin.
Following this pattern, the recent TD Sequential reversal signal could also apply to the asset. And since this time it is a downtrend, the analyst expects a correction that will last one to four candles per day.
BTC price
Bitcoin's recent momentum has seen the asset become one of the best performers in the industry, posting growth of around 16% in the past week.
The coin is currently hovering around the $52,500 mark. The chart below shows the asset's performance over the last month.

The price of the coin seems to have increased significantly recently | Source: BTCUSD on TradingView
Featured image by Kanchanara on Unsplash.com, charts by TradingView.com
Learn Crypto Trading, Yield Farms, Income strategies and more at CrytoAnswers
https://nov.link/cryptoanswers
Comments are closed.