


Bitcoin. Source: Adobe
After reaching the highest level since the FTX cryptocurrency exchange crash last November, spot bitcoin trading volume has declined significantly over the past month thanks to significant volatility and zero trading fees for BTC pairs on Binance.
Bitcoin spot trading volume on major exchanges was around $16.4 billion as of Friday, according to data from CoinGecko’s API.
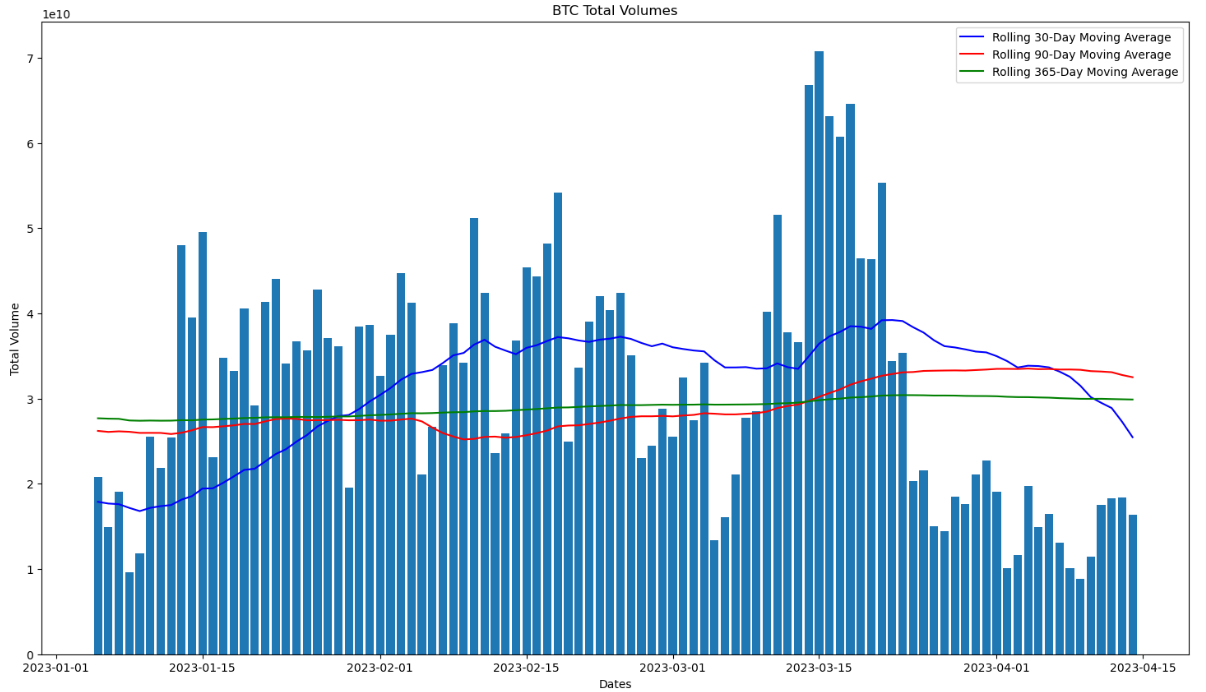
That compares to nearly $70 billion this time last month.
And it’s not just short-term volumes that have weakened recently.
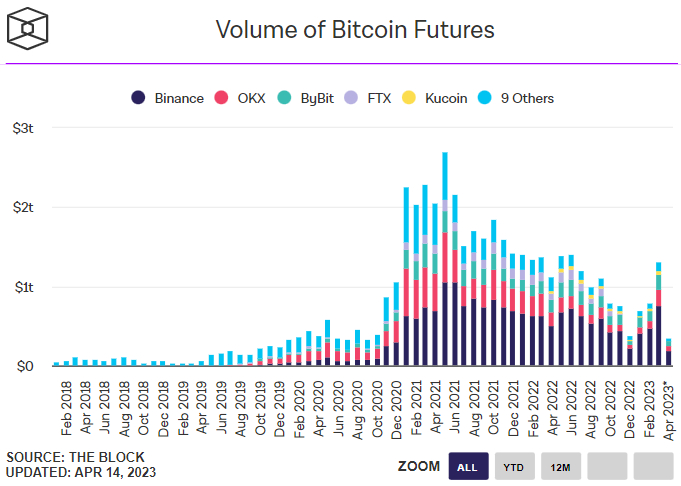
According to data presented by crypto analytics website The Block, bitcoin futures trading volume has only reached about $350 billion in mid-April to date.
For the entire month of March, Bitcoin futures trading volume was around $1.3 trillion.
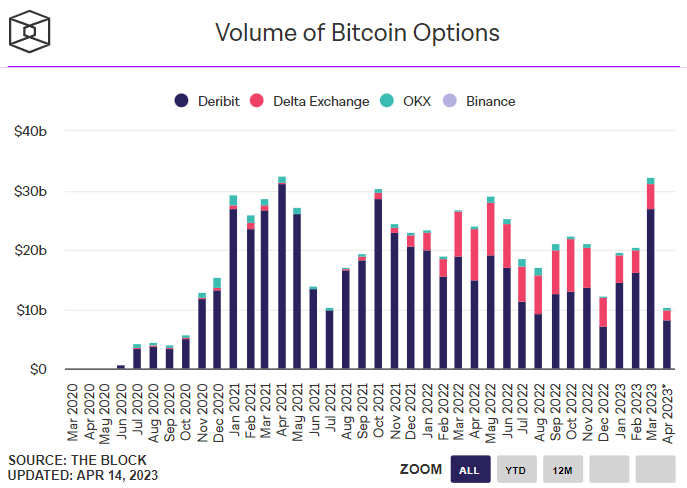
Options trading volumes are also tracking a weaker month, according to another chart presented by The Block.
Weaker volumes a threat to the bull market thesis?
Some might interpret weaker trading volumes as an indication of waning demand for bitcoin.
While it’s true that historically large trading volume spikes have coincided with price spikes, such as Bitcoin’s in the first half of 2021, the relationship between higher volumes and higher prices is weak.
This is borne out by the fact that Bitcoin has continued to push higher over the past few weeks despite slowing trading volumes.
In fact, on Friday, BTC price surged above $31,000 for the first time since June of last year, bringing its monthly gains to around 7.0% — a month that saw volume down significantly from March.
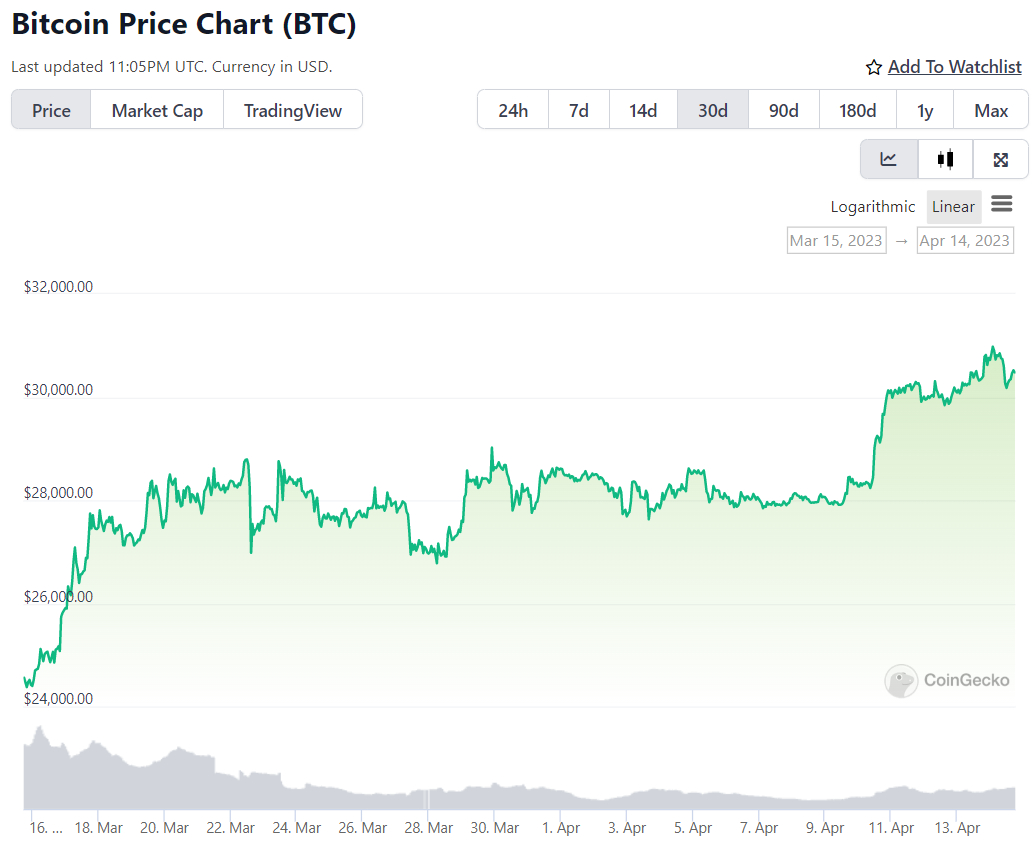
While an increase in trading volume would be welcome (if fueled by an inflow from new demand for Bitcoin), BTC price could well continue to rise for now.
That’s because Bitcoin currently has a lot of very important tailwinds.
Bitcoin will continue to benefit from technical, macro, and on-chain tailwinds
Chart analysis suggests that a sustained bullish move in bitcoin price remains a clear probability.
Since breaking north of last month’s mid-$29,000 highs, BTC has now opened the door to the next major resistance area around $32,300 (the late May/June 2022 highs).
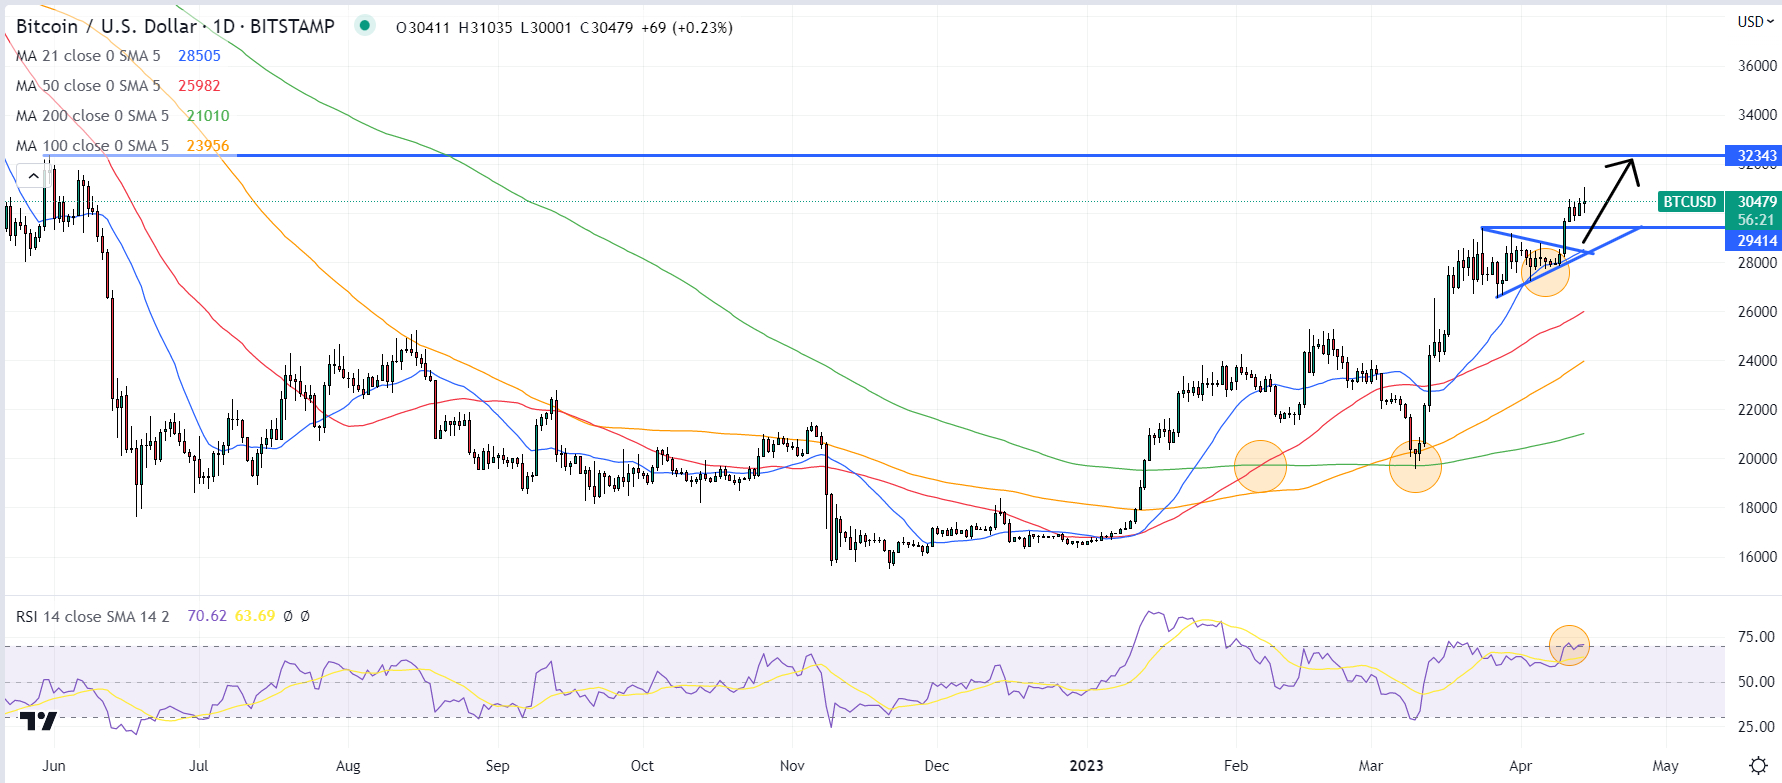
All of BTC’s major moving averages are moving higher in consecutive order, and the 21-day moving average recently offered strong support, a vote of confidence in Bitcoin’s short-term momentum.
Other longer term technical signals from the major moving averages are also positive.
Bitcoin’s strong recovery in mid-March from a retest of the 200DMA (and realized price) of just under $20,000 was interpreted by many as bull market confirmation at the time and continues to provide tailwinds.
Additionally, the golden cross in BTC price in early February — historically a very bullish signal for BTC — is another longer-term technical tailwind for the price action.
Bitcoin’s 14-day Relative Strength Index (RSI) is flirting with being in overbought territory, suggesting that the risk of near-term profit-taking is increasing.
However, this doesn’t always stop BTC from continuing a decent streak of near-term gains, with the recent price rally from mid-January to February being a good example.
Positive chain trends also indicate that Bitcoin’s trading bias will remain decidedly bullish in the medium to long term.
First, core on-chain metrics related to network utilization (thus acting as a proxy for “demand” for the Bitcoin network).
Metrics like the number of daily active addresses, the number of addresses with non-zero balances, the number of new addresses, and the number of daily transactions are all trending higher, according to data from crypto analytics firm Glassnode.
Meanwhile, other on-chain metrics, like those monitored in the Glassnode dashboard “Recovering from a Bitcoin Bear,” are all screaming bull markets.
This dashboard tracks eight indicators to determine if bitcoin is trading above major price models, whether or not network utilization momentum is increasing, whether market profitability is returning, and whether the balance of USD-denominated bitcoin assets favors long-term HODLers.
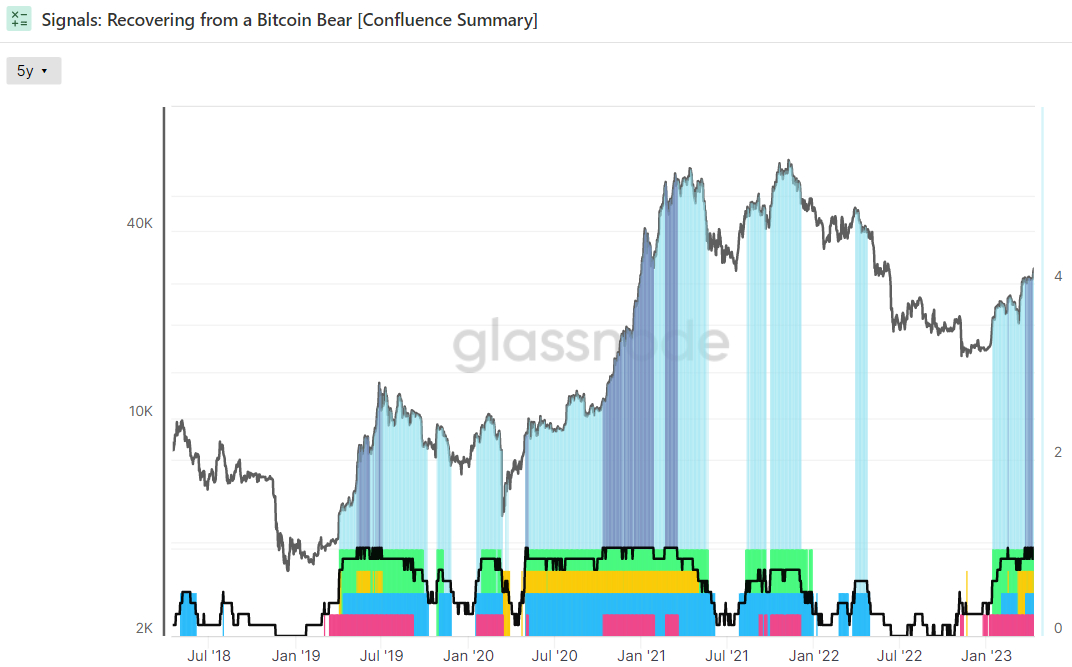
Since mid-March, all eight indicators have been flashing green more or less in unison, the longest such phase in just over two years.
Historically, the moment all indicators on the dashboard turn green (ie now) was a great long-term buying opportunity.
With the US economy headed for recession and deflation and a Fed rate cut cycle looming, the macroeconomic conditions are certainly in place for a sustained Bitcoin bull market.
Not to mention the widely anticipated continued global adoption of bitcoin (and crypto more generally), which is really the main long-term bullish argument.
Learn Crypto Trading, Yield Farms, Income strategies and more at CrytoAnswers
https://nov.link/cryptoanswers
Comments are closed.