


Solana has been witnessing strong bullish force for the past seven days, however, as of the writing of this article, the bulls are losing momentum. In the last 24 hours, the coin has depreciated by 9%. The current support level for SOL was $38. The asset’s price posted a monthly high after the massive rally of July 13th. The technical outlook for Solana envisioned the bears taking over.
After bitcoin fell 6% on its chart over the last day, altcoins also had the same effect on their charts. Flashes of negative price action have significantly reduced Solana’s purchasing power. After a recovery rally, it is usually not uncommon for coins to decline on their charts.
If purchasing power strengthens, Solana could break through its current price level again and target the overhead price cap. If SOL manages to push the $44 price mark, a visit to the $50 mark doesn’t seem too difficult. Buying power and broader market strength will help Solana regain price momentum. The global cryptocurrency market cap today is $1.07 trillion with a 5.1% negative change in the last 24 hours.
Solana price analysis: four hour chart
Solana was priced at $41 on the four-hour chart | Source: SOLUSD on TradingView
SOL was trading at $41 at the time of writing. The bulls lost momentum after reaching the $46 price level. Overhead resistance for Solana was $48, a move above it that could help Solana reach $50 and even scale above it.
A decline from the current price level will ensure SOL touches $38 and then touches the $30 support line. If purchasing power holds, SOL could trade in the same price range before trying to move higher. The traded amount of SOL has increased indicating an increase in purchasing power, which may indicate a recovery on the four-hour chart.
Technical Analysis
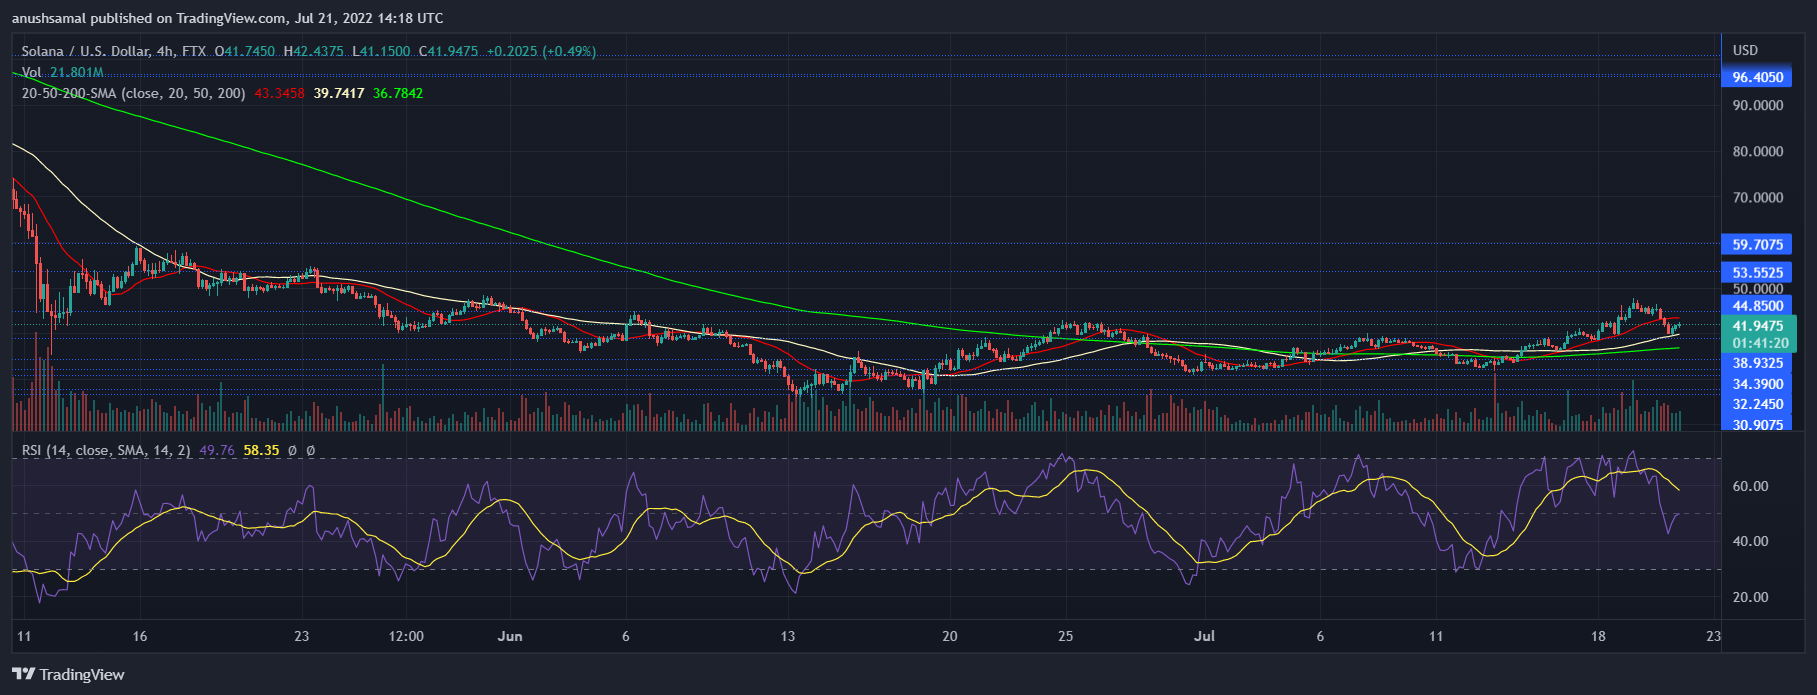 Solana showed negative buying power on the four hour chart | Source: SOLUSD on TradingView
The altcoin’s purchasing power remained low, with sellers dominating price action on the chart. Accordingly, the Relative Strength Index showed the same emotion. The RSI was plotted below the half line and that signified decreased buying power.
Although the number of buyers decreased, the indicator recorded an upward trend that can be described as bullish. The price of SOL traded below the 20-SMA, suggesting that sellers are driving the price momentum in the short-term. However, Solana was above the 50-SMA and the 200-SMA, which meant that an upward move could see a recovery.
Recommended Reading | Solana gives 70% more shine – can SOL keep the lights on?
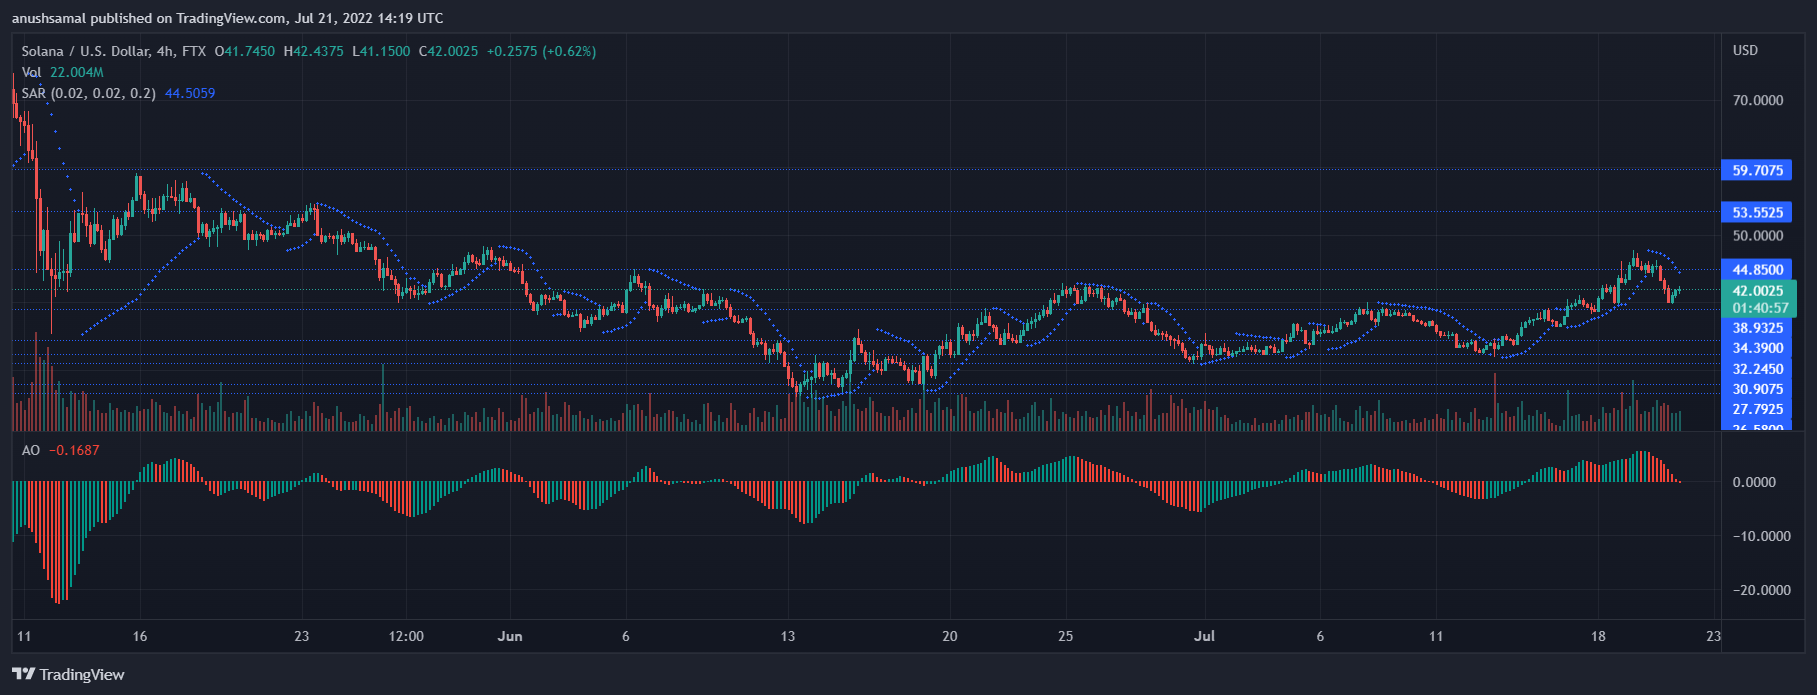 Solana issued a sell-signal on the four hour chart | Source: SOLUSD on TradingView
SOL caught the drop in purchasing power and displayed a sell signal. Awesome Oscillator shows price direction and momentum along trend reversals. AO formed red sell signal bars representing a sell signal for the asset.
Parbolic SAR also indicates the price direction, dotted lines above the candle meant the price direction was negative at the time of writing. For Solana to move higher, buying power on the chart must increase.
Related Reading | Solana and Avalanche poised for gains as crypto market enjoys fresh tailwinds
Feature image from The Financial Express, chart from TradingView.com
Learn Crypto Trading, Yield Farms, Income strategies and more at CrytoAnswers
https://nov.link/cryptoanswers
Comments are closed.