


Shiba Inu was gaining momentum just a week ago when it surged 35% following news of the Robinhood listing.
The broader market is currently showing weakness as Bitcoin continues to struggle below the $40,000 level. Ethereum was also priced at $2900 at press time. The King altcoin has been rejected from the $3000 level in the past trading sessions.
The meme coin is currently consolidating. SHIB was sandwiched between $0.00003000 and $0.00002000 respectively.
Purchasing power was subsequently affected by consolidation. In the last 24 hours, Shiba Inu lost 3% of its value and in the past week it lost 7% in value. The global cryptocurrency market cap was $1.93 trillion down 1.4% in the last 24 hours.
Shiba Inu Price Analysis: One-Day Chart
Shiba Inu is showing the Adam and Eve pattern on the 24 hour chart. Image source: SHIB/USD on TradingView
Shiba Inu is priced at $0.00002369 at the time of writing. Prices have been moving sideways for some time. Buyers have chosen to stay away from the meme coin as the short-term reading indicates bearishness on the charts. However, the coin is showing a bullish pattern on the one-day chart.
The chart above showed and continues to show the “Adam” and “Eve” pattern continuously for the 109th day. This technical formation is considered bullish.
The two prominent valleys formed on the charts are referred to as Adam (triangle) and Eve (semicircle). At $0.00003289, SHIB is expected to see a breakout and then target $0.00004436, which would mark a 60 percent increase from current price levels.
If Shiba Inu continues to decline, the next support line is $0.00002068.
Recommended Reading | Metaverse Madness: Check out these 3 Metaverse Coins – The Sandbox (SAND), Shiba Inu (SHIB), Pac-Man Frog (PAC)
Technical Analysis: Four hour chart
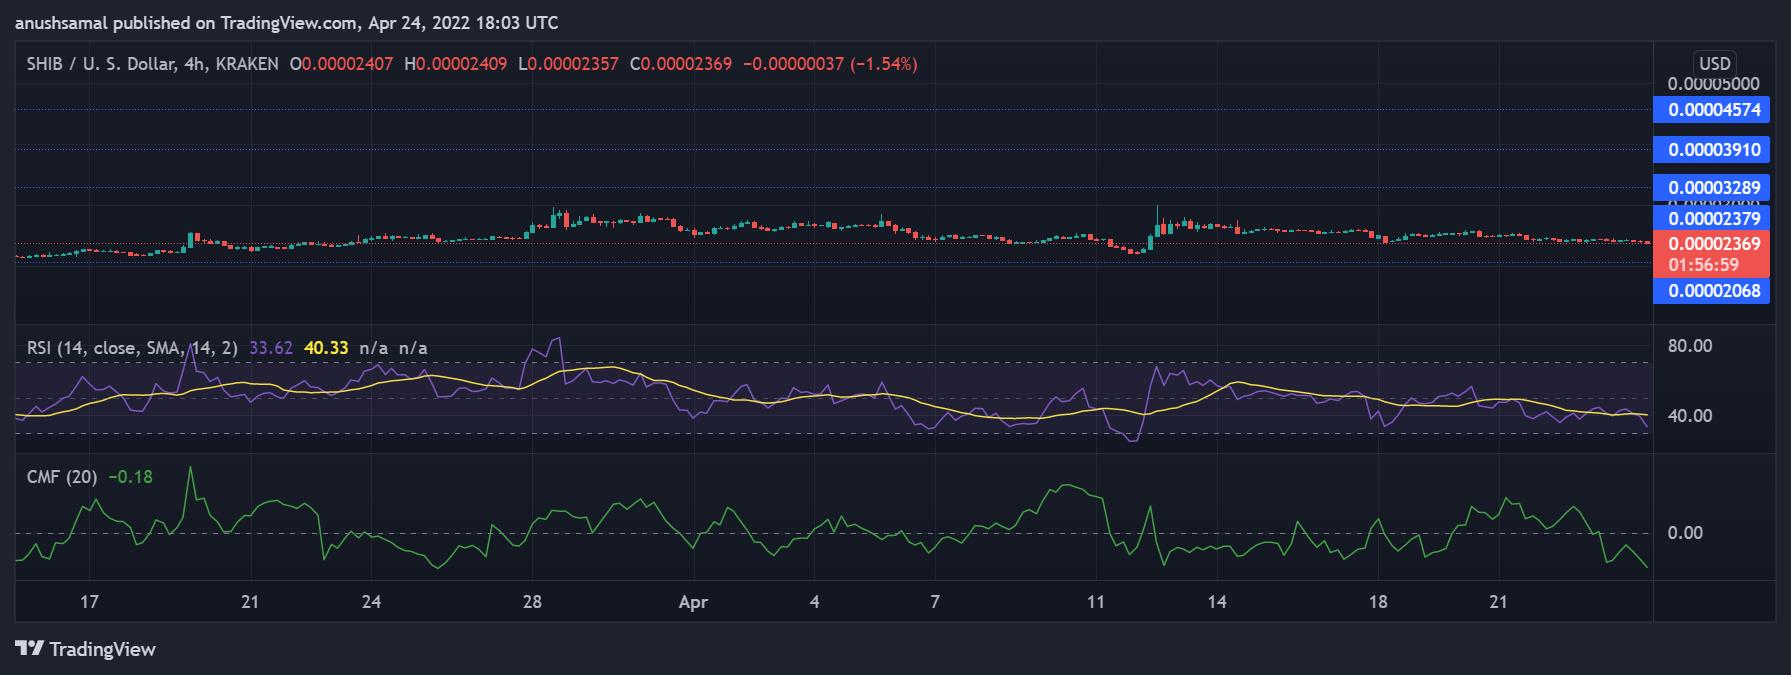 Shiba Inu has seen a drop in purchasing power on the four-hour chart. Image source: SHIB/USD on TradingView
Consistent consolidation has left buyers with a dilemma of whether to HODL or not. As can be seen in the chart above, purchasing power has dropped significantly over the past week. In the next few trading sessions, SHIB could break through its current price level and drop to the next price floor.
On the Relative Strength Index, SHIB was seen below the 40 mark, which would soon reach oversold territory. If touching the oversold level, SHIB could fall further. Chaikin Money Flow, which determines capital outflows, has suggested that inflows have been less than outflows.
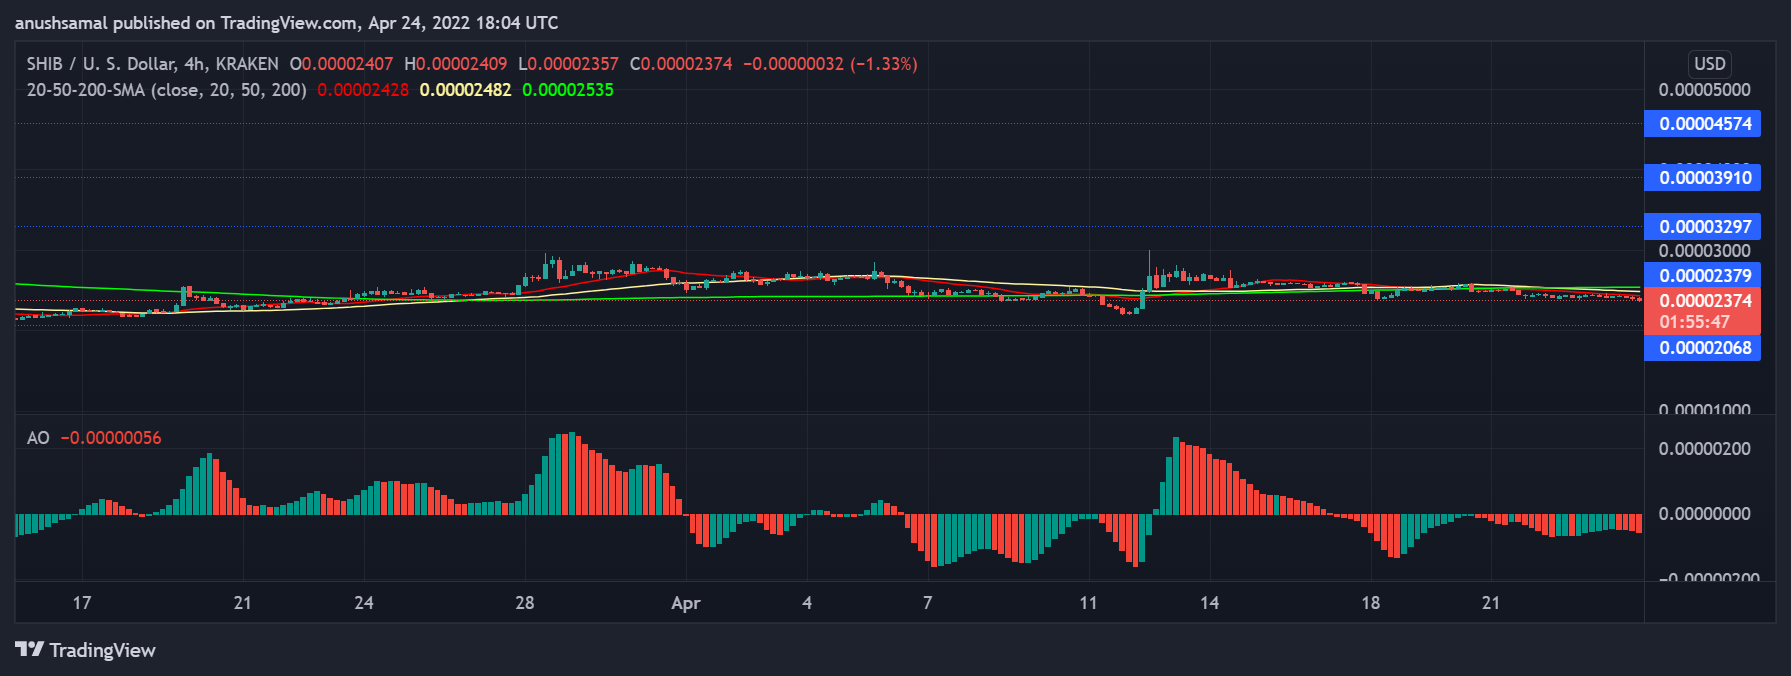 Shiba Inu is in negative price momentum on the four-hour chart. Image source: SHIB/USD on TradingView
SHIB’s prices have been trading below the 20-SMA line for the past week and are unchanged at press time. This established that sellers were in control of the market and were responsible for price dynamics. The above reading also confirmed the bearishness in the market.
Awesome Oscillator is suggesting the coin’s current price momentum. AO showed red histograms below the half line and that meant SHIB was in negative price action. A resurgence in buyers could immediately help SHIB emerge from price consolidation.
Recommended Reading | Move Over Bitcoin – Is Shiba Inu the Next Crypto Gold?
Learn Crypto Trading, Yield Farms, Income strategies and more at CrytoAnswers
https://nov.link/cryptoanswers
Comments are closed.