


Polkadot has finally managed to break the $5 rigid price resistance level. In the past 24 hours, DOT is up more than 6%. Over the past week, the coin has posted double-digit gains.
Bitcoin moved into the $18,000 price zone on its daily chart, pushing altcoins down their respective charts. Although DOT has rallied over the past 24 hours, the altcoin is still not out of the woods. The altcoin needs to stay above two price levels.
The technical outlook was still on the side of the bulls, but there has been a drop in accumulation on the daily chart, suggesting that demand has fallen. However, demand secured by DOT hit a multi-month high. Usually, after the coin has become overvalued, it will start a retracement on its chart.
Indicators showed that DOT will lose value on its chart in the following few trading sessions if buyers are not consistent. The altcoin market cap declined slightly over the past 24 hours, which meant that demand for the altcoin fell. Right now, DOT is trading 90% below its 2021 all-time high.
Polkadot Price Analysis: One-Day Chart
Polkadot was priced at $5.09 on the one-day chart | Source: DOTUSD on TradingView
DOT was trading at $5.09 at the time of writing. The coin traded within an ascending parallel channel (blue). The ascending parallel channel marked a bullish force in the market.
At the time of writing, Polkadot broke the ascending parallel channel, suggesting that DOT could consolidate in the following trading sessions before starting the retracement.
Immediate resistance for the coin was $5.30; If it manages to break this level, it could rally to $5.40. On the other hand, if Polkadot loses momentum, it will fall to $4.80. The altcoin needs to stay above the $4.80 level or the bears will fully take over.
Technical Analysis
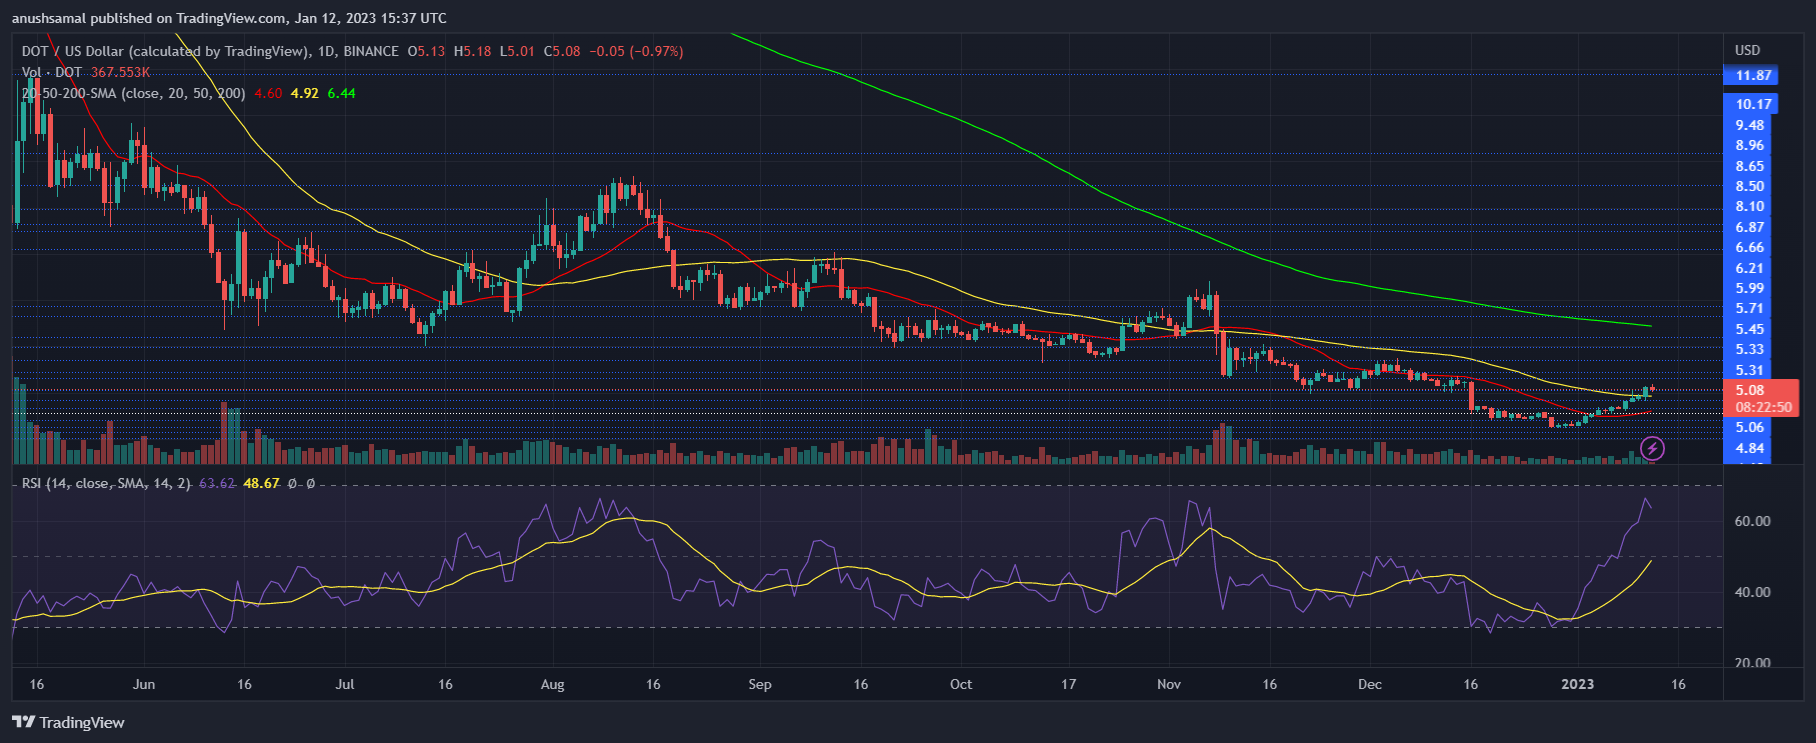 Polkadot registered a downward trend in the number of buyers on the one-day chart | Source: DOTUSD on TradingView
The altcoin was still in the bullish zone despite a slight drop in demand. The Relative Strength Index (RSI) was above the 60 mark with a slight downtrend; this indicated that while demand was falling, the price was under bullish control.
Similarly, the asset price was seen above the 20-Simple Moving Average (SMA), indicating that the bulls were driving price momentum in the market. As the RSI touched a multi-month high, the altcoin surged above the 50 SMA line (yellow).
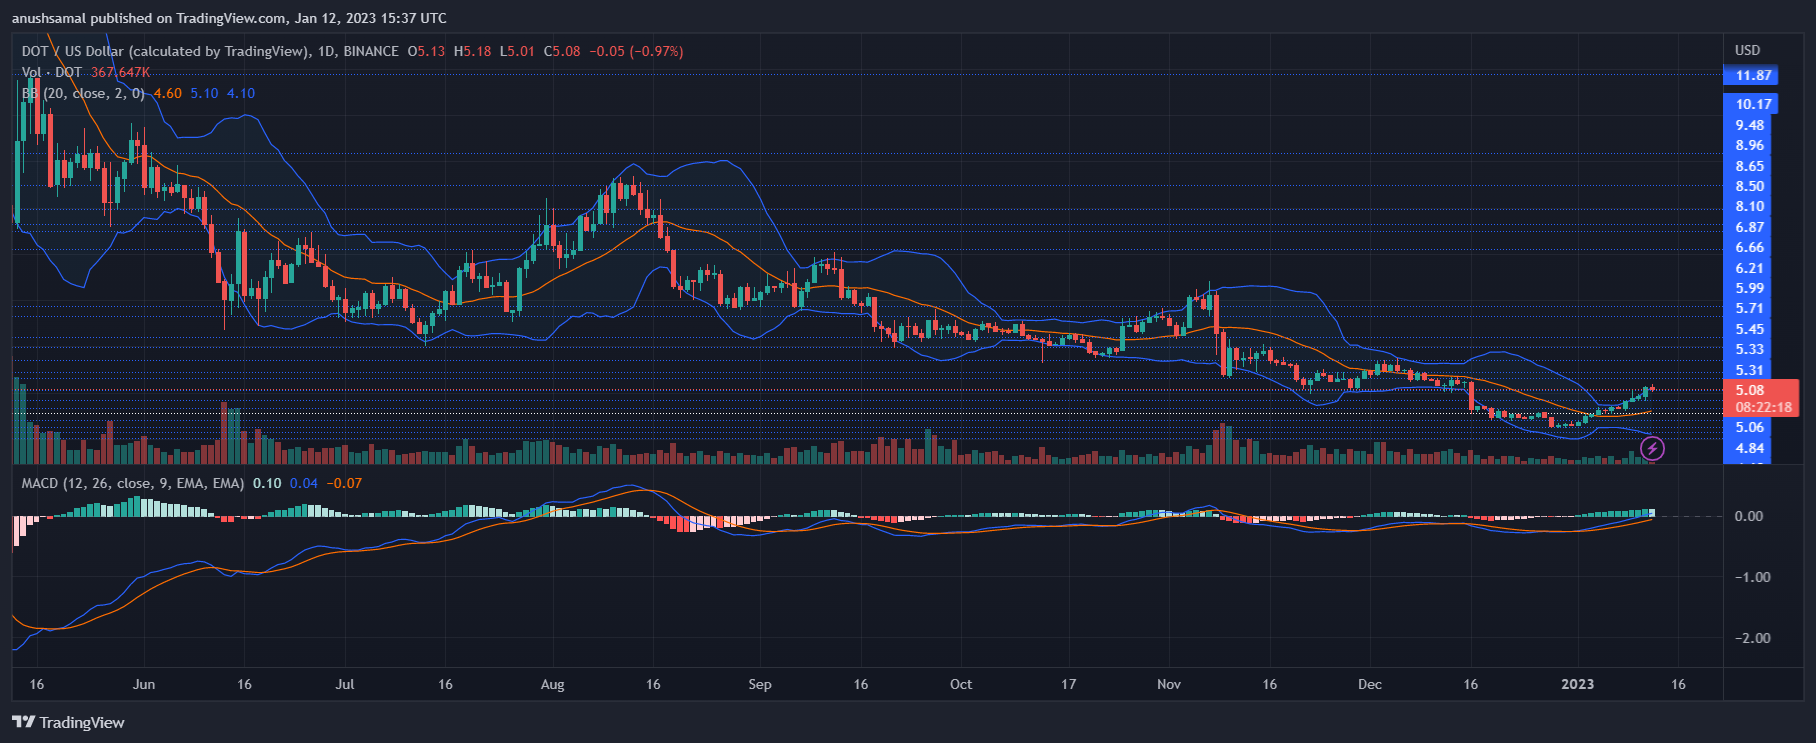 Polkadot showed buy signals on the one-day chart | Source: DOTUSD on TradingView
With demand rising, technical indicators suggested that traders could have a buying opportunity. The divergence of the moving average convergence indicates price momentum and reversals.
The indicator formed green signal bars tied to buy signals. The Bollinger Bands also grew apart in anticipation of a significant price move during the next trading session.
Featured image from Unsplash, charts from TradingView.com
Learn Crypto Trading, Yield Farms, Income strategies and more at CrytoAnswers
https://nov.link/cryptoanswers
Comments are closed.