


MATIC has now been on an uptrend for the past week. Despite the uptrend, it was not possible to surpass the $1 psychological level. Technical indicators have remained bullish on the chart, pointing to chances of reaching the $1 price ceiling.
Over the last week, MATIC is up 22% and on the daily chart, the coin is up 7%. MATIC had managed to scale $0.97, but a small dip in buying power caused the altcoin to briefly drop on the chart. Buying power was positive showing that bullish strength had not waned.
A pullback can take MATIC to the $0.77 level. If purchasing power remains constant, the coin may attempt to breach the $1 psychological price cap. At press time, MATIC had secured above the $0.75 support line.
The global cryptocurrency market cap today was $1.09 trillion, a 2.6% positive change in the last 24 hours.
MATIC price analysis: four hour chart
MATIC was valued at $0.87 on the four-hour chart | Source: MATICUSD on TradingView
The altcoin is trading at $0.87 at the time of writing. The coin had briefly touched $0.97 but was met with selling pressure. Overhead resistance for the coin stood at $0.92, a move above it that could force MATIC to touch $1.
Local support for the coin was $0.77, a drop from this level will see MATIC reach $0.60. The MATIC quantity traded during the last trading session has decreased slightly, indicating that the buying power on the chart has decreased.
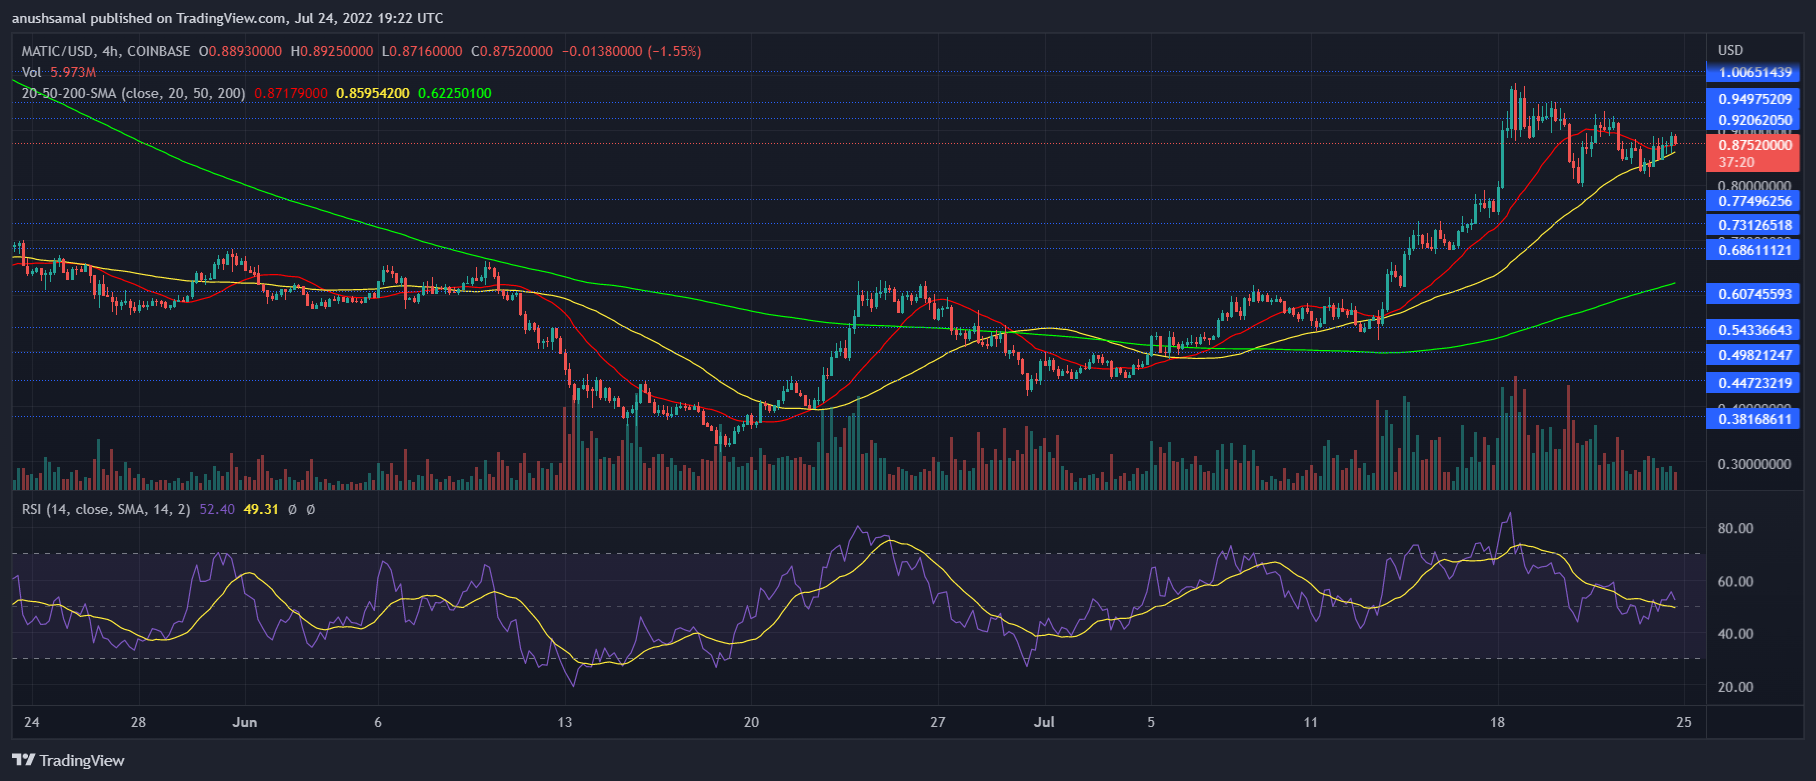 MATIC showed positive buying power on the four hour chart | Source: MATICUSD on TradingView
The altcoin had visited the overbought zone a few times, but as the coin depreciated, purchasing power waned. At the time of writing, purchasing power was still greater than selling power.
The Relative Strength Index was plotted above the half line, meaning there were more buyers.
The altcoin’s price traded above the 20-SMA line, meaning buyers were driving price momentum in the market. This was a sign of bullishness for the altcoin.
Related Reading | Bitcoin Funding Rate Stays Positive, More Decline Soon?
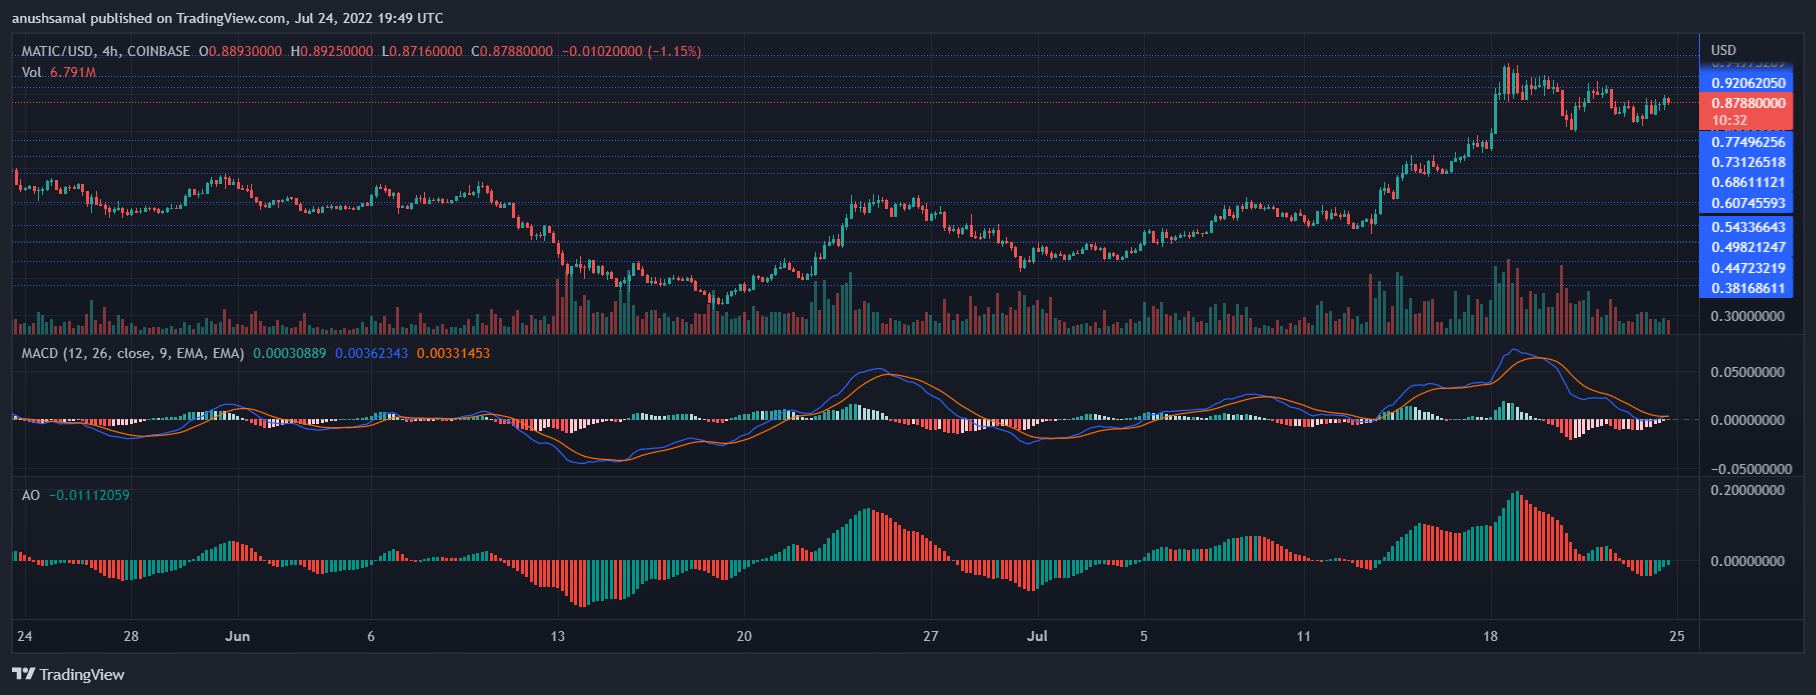 MATIC issued a sell-signal on the four hour chart | Source: MATICUSD on TradingView
The altcoin saw a small drop in purchasing power and the technical indicator showed the same. The Moving Average Convergence Divergence shows the price dynamics and how they change. The MACD underwent a bearish crossover and formed red signal bars.
These red signal bars represent a sell signal for the altcoin. Awesome Oscillator represents the price trend and also indicates chances of a reversal, the green signal bars still represent bullish strength.
If the coin can continue to keep up with the pace, purchasing power must support the coin. Broader market strength will also help MATIC reach its psychological goal of $1.
Recommended Reading | Polygon (MATIC) looks set for a retracement after recent gains
Featured image from The Face, chart from TradingView.com
Learn Crypto Trading, Yield Farms, Income strategies and more at CrytoAnswers
https://nov.link/cryptoanswers
Comments are closed.