


Bitcoin (BTC) price fell sharply on January 3, erasing nearly two weeks of previous gains.
However, the price has regained its footing and has almost erased the decline and returned near its previous highs.
Bitcoin is consolidating above resistance
Technical analysis from the weekly time frame shows that BTC price has been in an uptrend since the beginning of 2023. The advance accelerated as the weekly Relative Strength Index entered overbought territory (green).
The RSI is a momentum indicator that traders use to assess whether a market is overbought or oversold and whether they should accumulate or sell an asset. Readings above 50 and an uptrend suggest bulls still have the advantage, while readings below 50 indicate the opposite.
Interestingly, something similar happened in the previous upcycle (yellow) in terms of price and RSI movement.
Currently, BTC price is trading above a key horizontal and Fibonacci retracement resistance level.
BTC/USDT weekly chart. Source: TradingView
Speculation about the possible approval of the BTC Exchange Traded Fund (ETF) is rife. The Securities and Exchange Commission (SEC) will make a decision on the ETF between January 8th and 10th. Coinbase is poised to play an important role as an intermediary between exchanges and the crypto market once the ETF is approved.
However, more than 60% of financial advisors do not expect the SEC to approve the ETF. This is in stark contrast to crypto enthusiasts, almost 90% of whom believe approval is imminent.
Read more: Where to trade Bitcoin futures
Will the Bitcoin ETF be approved?
Eric Balchunas, senior ETF analyst at Bloomberg, expects the BTC ETF to be approved. He expects leaks and talk before the actual decision and tweets:
However, in the next 72 hours we will see leaks/chatter that the SEC has verbally approved, which is true. And we'll see 19b-4 refilled, which you think means we get home free. But not 100% official until the SEC says so.
Cryptocurrency analyst Scott Melker explained that he heard that issuers already knew that the ETFs would be approved and that issuers are aware of this and are preparing for it.
Caitlin Cook presents a very interesting thread. She points out that while crypto enthusiasts are optimistic about the potential of ETF approval, they are still drastically underestimating the possible long-term impact.
The registered investment advisory industry manages $114 trillion in assets. Many people around the world are seeking a modest crypto allocation with potential upside, seeing it as a volatile but enticing segment of their portfolio.
Despite the diverse perspectives of crypto enthusiasts, most investors want a simple, fixed approach. While some may find crypto ETFs mundane, they bring significant participants and mark just the beginning of a broader trend.
Read more: Who will own the most Bitcoins in 2024?
BTC Price Prediction: What Happens Until the ETF?
Unlike weekly analysis, technical analysis on the daily time frame presents a mixed outlook based on price action, Elliott wave count, and RSI values.
Technical analysts use Elliott Wave Theory to determine trend direction by examining recurring long-term price patterns and investor psychology.
The most likely count suggests that price has completed wave four in a five-wave upward move. An ascending parallel channel contained wave four, which was a running flat correction. Such corrections are often followed by significant upward movements.
However, the daily RSI has created a bearish divergence, a sign of weakness. There was already a Bitcoin decline following the divergence, so the bearish signal may have come to fruition.
If BTC price breaks out of the channel, it can rise by 15% to the next resistance at $50,800. The external retracement of wave four around 2.61 creates resistance.
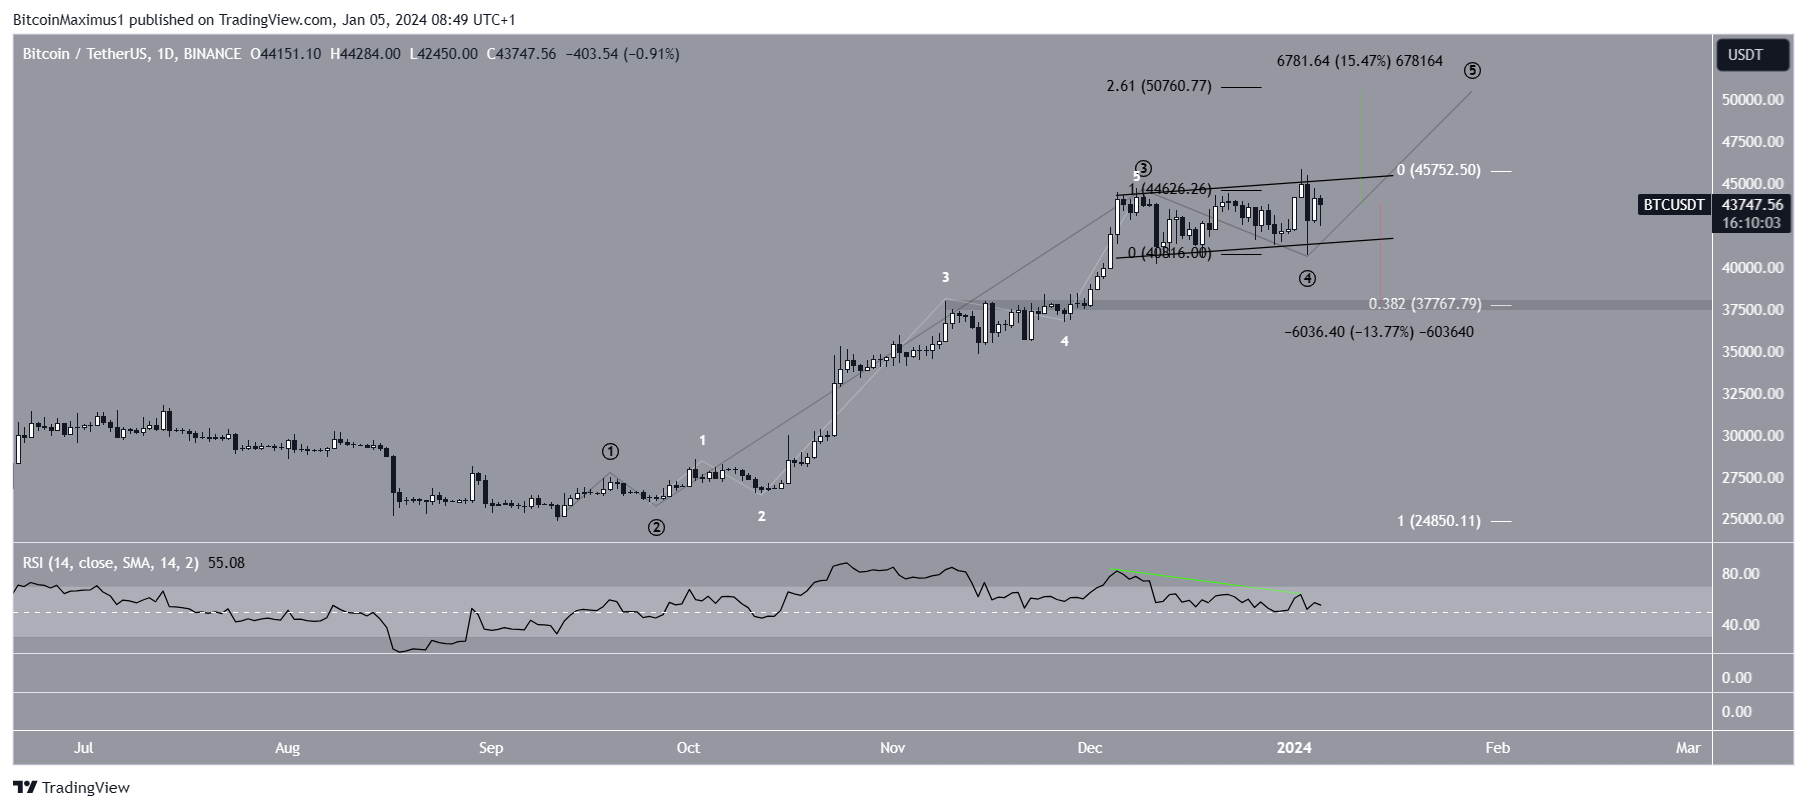 BTC/USDT daily chart. Source: TradingView
A very interesting fractal dates back to November 2020. Back then, Bitcoin price went through a similar fourth wave in an ascending parallel channel before a breakout led to a parabolic rally.
Interestingly, this happened shortly after the weekly RSI crossed into overbought territory, as described in the first section.
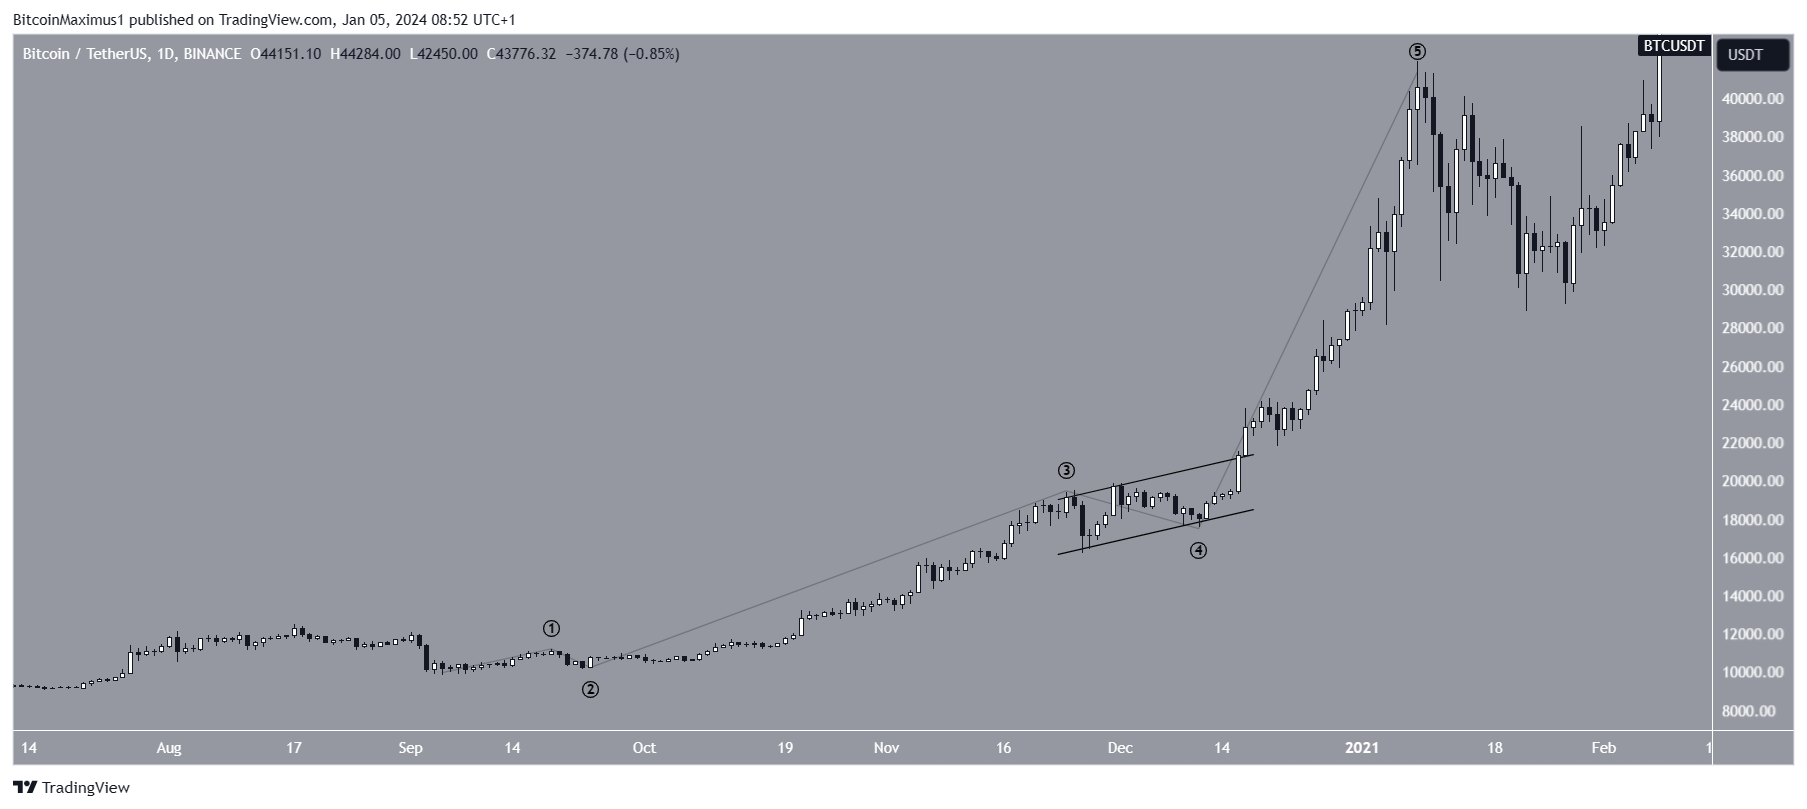 BTC/USDT daily chart. Source: TradingView
Despite this bullish BTC price prediction, a break above the channel means the price is still correcting. This could lead to a 14% decline to the next support at $37,800.
For the latest crypto market analysis from BeInCrypto, click here.
A Basic Guide to How Bitcoin Transactions Work – YouTube
Disclaimer
In accordance with Trust Project policies, this pricing analysis article is for informational purposes only and should not be considered financial or investment advice. BeInCrypto is committed to accurate, unbiased reporting, but market conditions are subject to change without notice. Always do your own research and consult a professional before making any financial decisions. Please note that our Terms and Conditions, Privacy Policy and Disclaimers have been updated.
Learn Crypto Trading, Yield Farms, Income strategies and more at CrytoAnswers
https://nov.link/cryptoanswers
Comments are closed.