


Cardano has been on an uptrend and has managed to surpass the crucial resistance level. Over the past week, ADA is up nearly 20%. The altcoin has been moving up in an ascending trend line for the past 24 hours. Currently, the altcoin has stabilized at the $0.47 support line.
Now Cardano has finally managed to maintain its old resistance level and the bulls are back. For bullish momentum to be amplified, ADA needs to stay above the resistance level it crossed above. However, it is still too early to tell if ADA is in an uptrend or if this is a recovery rally.
Bitcoin’s bullish move and surpassing $22,000 has pushed other altcoins into bullish price action. The buyers have returned to the market, bolstering the bulls.
Broader market sentiment can pull ADA back to its immediate support level. The global cryptocurrency market cap today is $1.11 trillion, a 5.4% Change in the last 24 hours.
Cardano price analysis: four-hour chart
Cardano was priced at $0.506 on the four-hour chart | Source: ADAUSD on TradingView
ADA was trading at $0.506 at the time of writing. The coin broke the $0.50 price level, which it has struggled to surpass for the past few weeks. Overhead resistance for the coin stood at $0.53, but a slight loss of momentum could drag it to $0.47.
For the bears to remain subdued, Cardano needs to stay above the $0.50 level for the next few trading sessions. Purchasing power must also remain high for ADA to continue sailing north. The traded amount of Cardano remained high, indicating increased buying power on the chart.
Technical Analysis
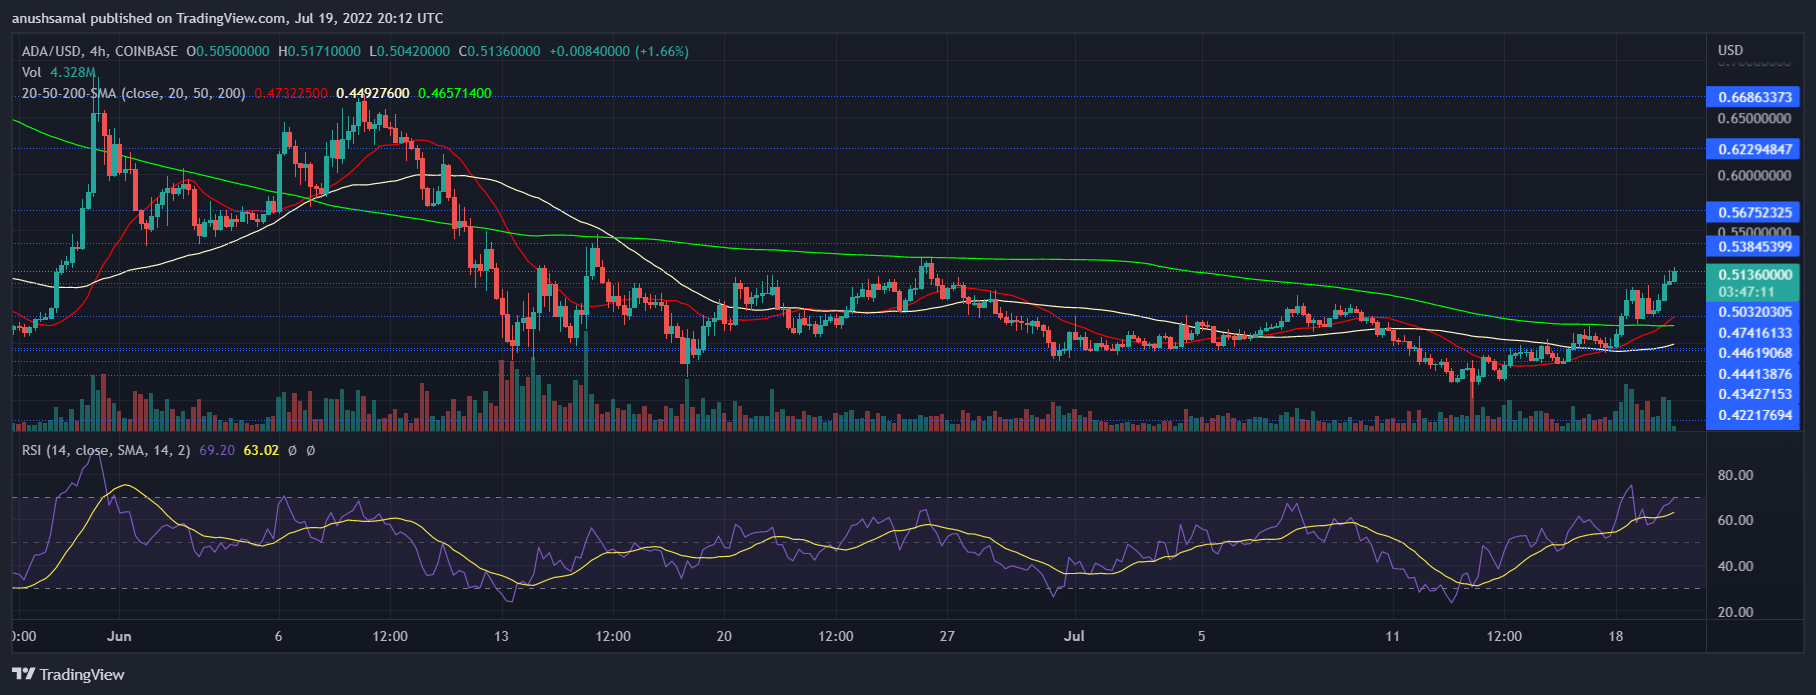 Cardano recorded high buying power on the four-hour chart | Source: ADAUSD on TradingView
ADA showed buying power on the four-hour chart. Buyers are in control and this could push Cardano to continue rallying. Consistent with this, the Relative Strength Index was above the 60-point level, suggesting that buyers outnumbered the chart.
The price of ADA traded above the 20-SMA which also suggests that the buyers have been driving the price momentum in the market. Cardano was also above the 50 SMA and 200 SMA lines, which indicated bullishness.
Related Reading | Why Cardano (ADA) is likely to surge to $0.60 by the end of 2022, experts predict
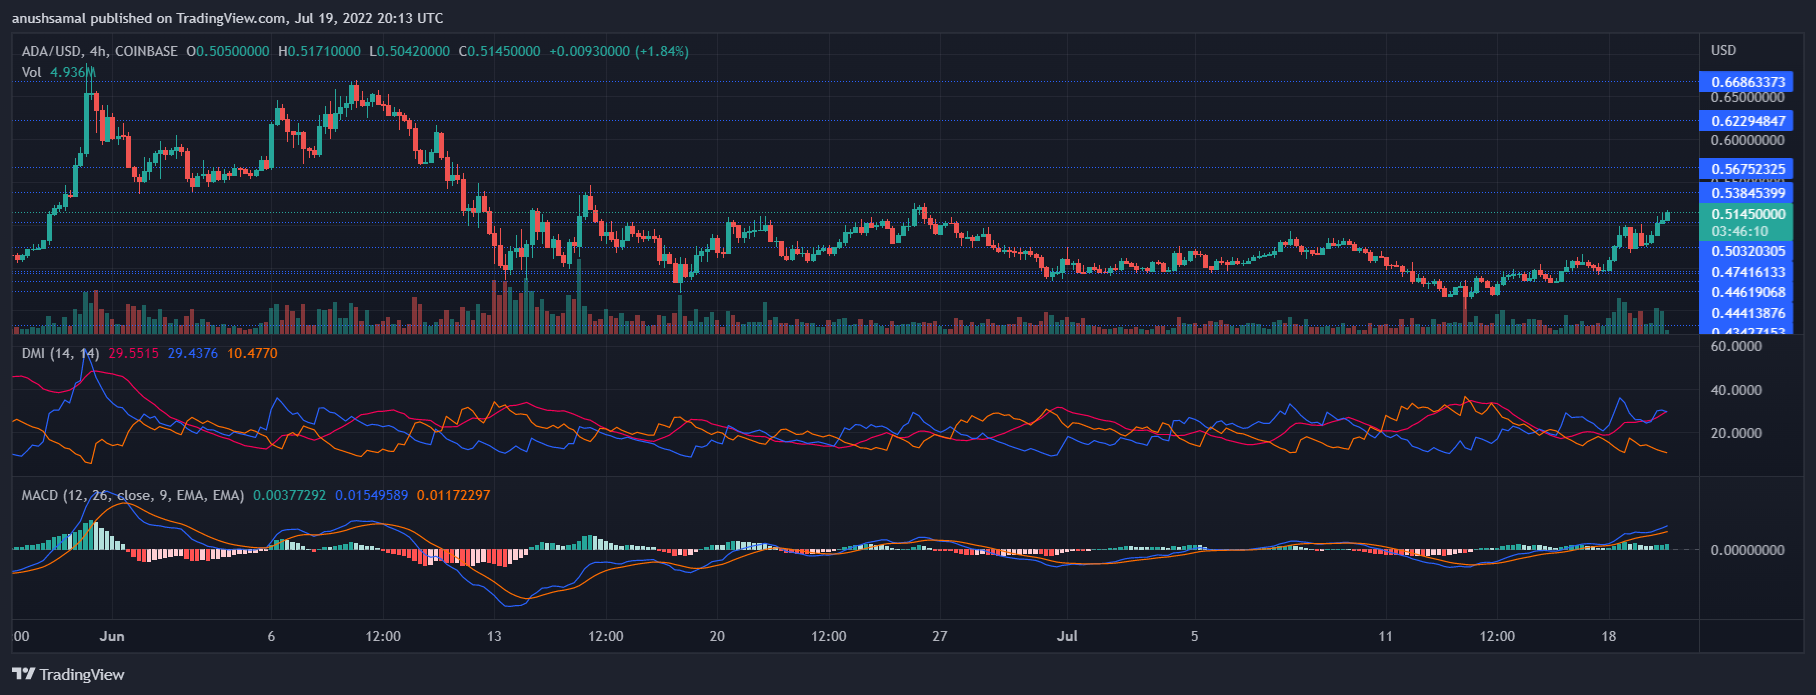 Cardano showed a buy-signal on the four-hour chart | Source: ADAUSD on TradingView
Other indicators turned bullish as Cardano started moving higher. Moving Average Convergence Divergence shows price momentum and trend reversals.
The MACD underwent a bullish crossover and painted green histograms, which is considered a buy signal on the chart.
The Directional Movement Index determines which direction the coin is moving. The DMI was positive as the +DI was above the -DI line.
The Average Directional Index (Red) was approaching 40 and it means that the current trend is getting stronger. For ADA to continue its uptrend, buyers need to be present alongside pressure from the broader market.
Related Reading | Ethereum is clearing the vital resistance and it could reach $1500 again soon
Featured image from UnSplash, chart from TradingView.com
Learn Crypto Trading, Yield Farms, Income strategies and more at CrytoAnswers
https://nov.link/cryptoanswers
Comments are closed.