


On-chain data shows that capital inflows into cryptocurrencies currently look similar to December 2020, just before Bitcoin rose from $18,000 to $65,000.
Bitcoin and Ethereum are currently receiving capital injections of $19.7 billion
As analyst Ali explained in a new post on X, Bitcoin and Ethereum are currently seeing large capital inflows. To illustrate these positive flows, the analyst pointed to the “BTC + ETH Net Position Change” indicator from on-chain analytics firm Glassnode.
This metric tracks the 30-day change in the combined realized cap of these two leading cryptocurrencies. The “realized cap” here essentially refers to the total amount of capital (in USD) that investors have used to purchase a particular asset.
Therefore, the metric's net position change could provide clues as to whether the total amount invested in the coin in question has increased or decreased over the past month.
Now here is a chart showing the trend of this indicator for Bitcoin and Ethereum over the past few years:
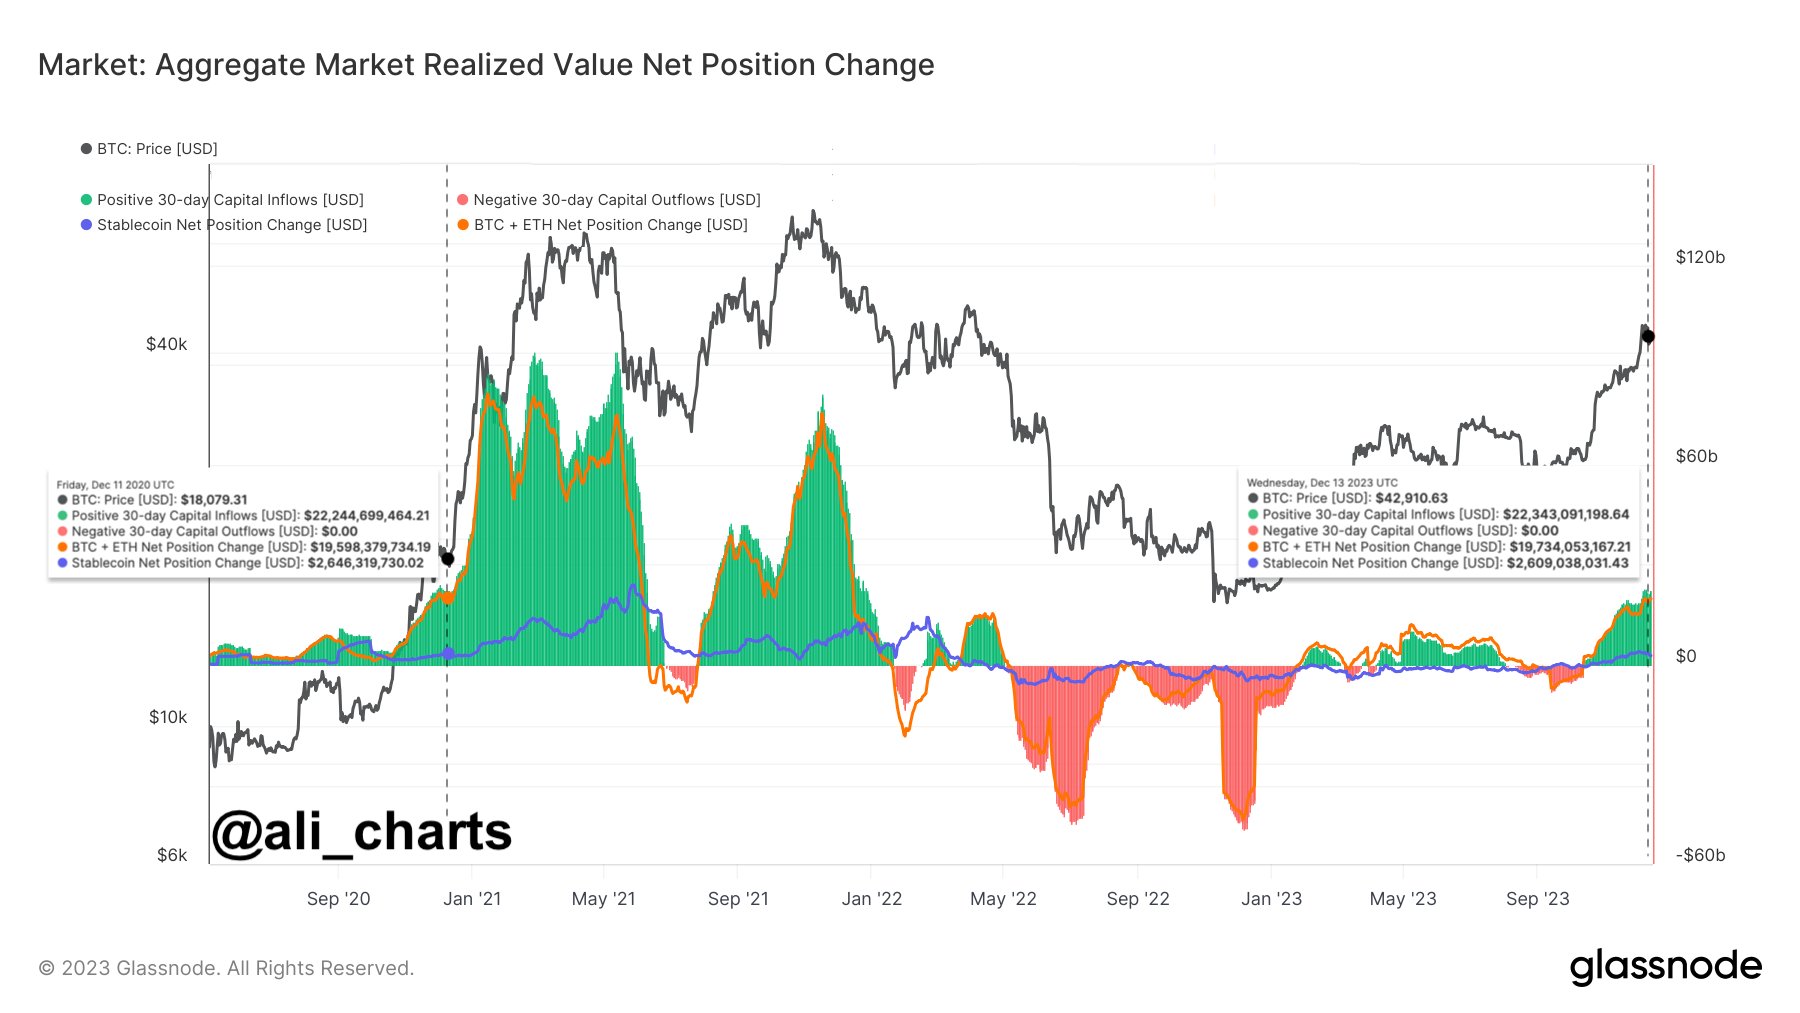
The value of the metric appears to have increased in recent days | Source: @ali_charts on X
As shown in the chart above, Bitcoin + Ethereum's net position change has been in positive territory recently and has only increased. The trend makes sense, of course, as both assets posted some strong gains over the last month.
Currently, the indicator is worth $19.7 billion. As Ali pointed out: “This This is roughly the same capital inflow that we saw in December 2020 before BTC went from $18,000 to $65,000!”
The same chart also shows data for two other metrics. The first is the “Stablecoin Net Position Change,” which, as the name suggests, tracks the monthly inflows and outflows of the major USD stablecoins in the industry.
In contrast to Bitcoin and Ethereum, this key figure does not use the realized upper limit, but only the supply of the stable. This is obviously due to the fact that these coins have mostly the same value at all points in time, so the realized cap would be no different from the market cap (which itself is equal to the supply since the price is $1).
From the chart, it can be seen that stablecoins have also seen positive inflows recently. This means that all three major asset classes in the sector, Bitcoin, Ethereum and Stables, are currently receiving capital injections.
Most capital inflows and outflows into the cryptocurrency sector occur through these three. The altcoins only receive their capital through a rotation from these core assets.
Thus, the stablecoins and the two major cryptocurrencies experiencing positive inflows at the same time have historically been a very bullish combination for the entire sector. This constructive combination failed to materialize for most of this year, but finally formed on the final leg of the rally.
The final indicator on the chart tracks the net entries and exits of the entire sector by simply summing up the net inflows for BTC + ETH and the stables. As you can see, this key figure currently has a similar value to December 2020.
Looking at Bitcoin's historical performance after December 2020, it could mean that the BTC price is set for further price increases in the future.
BTC price
Bitcoin had recently rallied above $43,000, but it appears the coin has suffered a setback as it is now trading below that level again.

It looks like the asset's price has skyrocketed in the past day | Source: BTCUSD on TradingView
Featured image from Shutterstock.com, charts from TradingView.com, Glassnode.com
Learn Crypto Trading, Yield Farms, Income strategies and more at CrytoAnswers
https://nov.link/cryptoanswers
Comments are closed.