


Bitcoin price analysis shows BTC trading in a bearish flag pattern, trading in a range of $21,500 to $22.50. Bitcoin fell to a low of $21,542 on the daily chart and is facing multiple resistances at $22,000, also with the 100-day moving average proving to be a strong resistance.
Cryptocurrency price heatmap, Source: Coin 360
Bitcoin is trading at $21,675.80, down 0.44% over the past 24 hours. Bitcoin trading volume is down 40% in the last 24 hours, with a total of $17.1 billion traded. Bitcoin is trading below the MA50, MA100, and MA200 of $22,000, with the 50-day moving average serving as key support. The next key support levels for bitcoin price analysis are $20,800 and $19,800. On the upside, BTC is facing a strong resistance at $22,000. If the bulls can break this barrier, we could see a rally to $23,000 in the near term.
Bitcoin price analysis on the daily chart: bears dominate the market
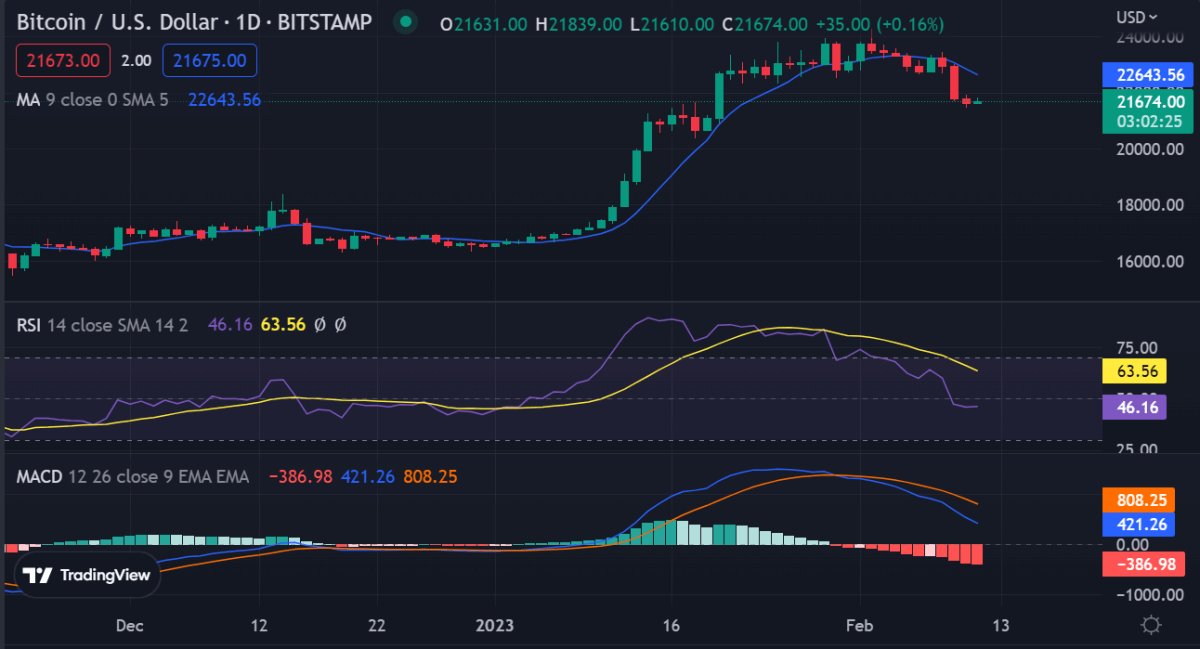
Bitcoin price analysis on the daily chart shows BTC trading in a bearish flag pattern with resistance at $22,000 and support at $21,500. The 100-day moving average has proven to be a strong resistance for bitcoin price analysis. If the bulls can break this level, we could see a rally to $23,000. On the other hand, if Bitcoin falls below $21,500 we could see a sell off to $20,500.
 BTC/USD 1-day chart Source: TradingView
Technical indicators are signaling a bearish outlook for Bitcoin price analysis. The MACD is in negative territory and trending down, suggesting that bears are dominating the market. The RSI indicator has fallen below 50, which indicates bearish market sentiment.
The Exponential Moving Average (EMA) is also sloping down and has breached the MA50, indicating a bearish outlook for bitcoin price analysis. The next key levels to watch are $20,800 and $19,800 while the resistance levels to watch are $22,000 and $23,000.
BTC/USD price analysis on a 4-hour chart: bears remain adamant in pushing prices lower
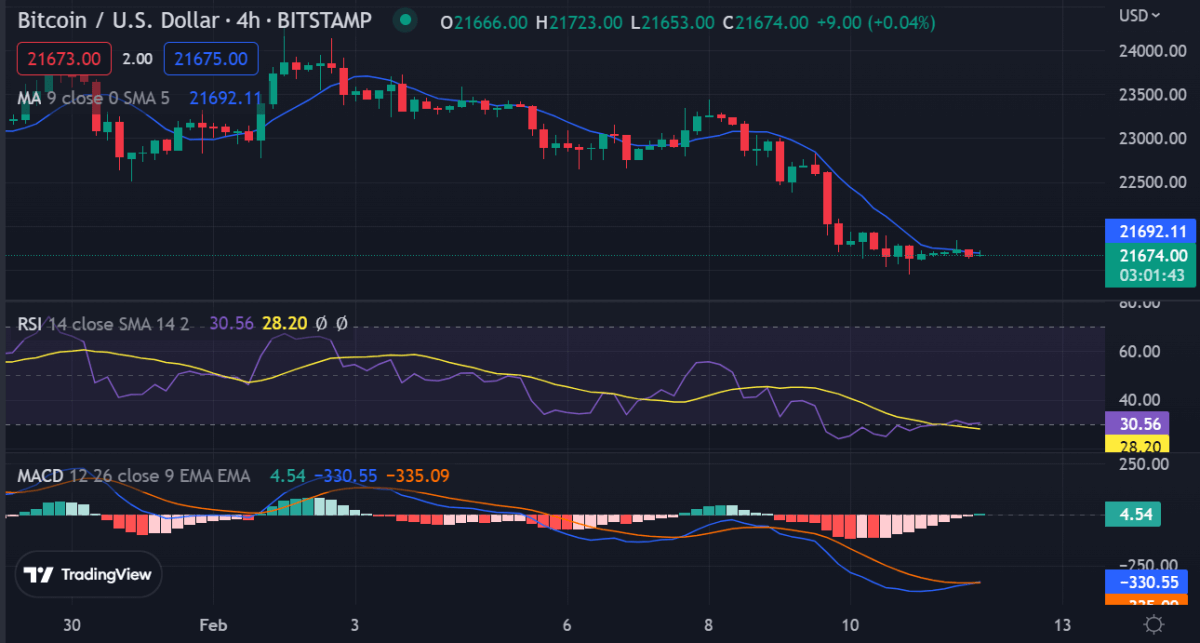
Bitcoin price analysis on the 4-hour chart shows BTC trading in a bearish channel formation with strong resistance at $22,400. The 100-period EMA has provided strong support for BTC and the price is currently trading above this level. Bitcoin price has consolidated around the $21,600 level and the bulls are struggling to push prices higher.
 BTC/USD 4 hour chart Source: TradingView
Bitcoin has formed a bearish divergence on the RSI indicator, suggesting that the bears are still in control of the market. The MACD is also trending down, indicating a bearish trend for BTC. The next key support levels are $21,400 and $20,800, while the resistance levels to watch are $22,400 and $23,000.
Bitcoin price analysis conclusion
Bitcoin price analysis for today shows that BTC is trading in a bearish flag formation and the bears are dominating the market. The key levels to watch are $20,800 and $19,800 while the resistance levels to watch are $22,000 and $23,000. Technical indicators are also signaling a bearish outlook for Bitcoin price analysis.]
While you wait for bitcoin to keep moving, check out our price predictions for XDC, Polkadot, and Curve
Learn Crypto Trading, Yield Farms, Income strategies and more at CrytoAnswers
https://nov.link/cryptoanswers
Comments are closed.