


- Bitcoin price could fall 12% into the weekly disequilibrium zone before regaining its ATH.
- Ethereum price is likely to fall by 10% before ETH becomes attractive to buyers.
- Ripple price could extend the decline with a bearish divergence amid a hidden continuation pattern.
- Market volatility has increased ahead of the Fed's interest rate decision.
The price of Bitcoin (BTC) slipped below the $65,000 threshold on Tuesday, dragging down the price of Ethereum (ETH) and Ripple (XRP). Volatility has also increased as markets await the Federal Open Market Committee's (FOMC) policy meeting on Wednesday.
However, with expectations of a pause in interest rates and the fact that further rate hikes are off the table, crypto market participants have reason to expect a rally in Bitcoin and altcoins. A pause would suggest the Fed is taking a more accommodative stance toward the economy, potentially leading to increased risk appetite among investors, which would be bullish for crypto.
Also Read: Bitcoin price moves further away from its all-time high of $73,777 and BTC halves in a month
Frequently asked questions about Bitcoin, altcoins and stablecoins
Bitcoin is the largest cryptocurrency by market capitalization, a virtual currency intended to serve as money. This form of payment cannot be controlled by a single person, group or organization, eliminating the need for third-party involvement in financial transactions.
Altcoins are all cryptocurrencies except Bitcoin, but some also consider Ethereum to be a non-altcoin since the fork occurs from these two cryptocurrencies. If this is true, then Litecoin is the first altcoin to emerge from the Bitcoin protocol and is therefore an “improved” version of it.
Stablecoins are cryptocurrencies designed to have a stable price and whose value is backed by a reserve of the asset they represent. To achieve this, a stablecoin's value is pegged to a commodity or financial instrument such as the US dollar (USD), with its supply regulated by an algorithm or demand. The main goal of stablecoins is to provide an entry and exit ramp for investors willing to trade and invest in cryptocurrencies. Stablecoins also allow investors to store value, as cryptocurrencies are generally subject to volatility.
Bitcoin dominance is the ratio of Bitcoin's market capitalization to the total market capitalization of all cryptocurrencies combined. It gives a clear picture of investor interest in Bitcoin. High BTC dominance typically occurs before and during a bull run, where investors resort to investing in relatively stable, large-cap cryptocurrencies such as Bitcoin. A decline in BTC dominance usually means investors are shifting their capital and/or profits into altcoins in search of higher returns, which usually triggers an explosion of altcoin rallies.
Bitcoin price could fall 12% into the weekly disequilibrium zone
Bitcoin price has formed a head and shoulders pattern on the daily time frame and is forecasting a 12% decline if the technical formation prevails. The market is trending lower with the Relative Strength Index (RSI) plummeting, suggesting momentum is fading.
The Awesome Oscillator (AO) is also approaching the mean with its red flashing histogram bars. If the bears have their way, BTC price could fall into the weekly imbalance ranging from $52,985 to $59,005.
BTC/USDT 1-day chart
On the other hand, if bulls manage to convert the neck line of the head and shoulders pattern into support, Bitcoin price could extend northwards and negate the bearish thesis above the $69,000 threshold.
Also Read: Bitcoin price presents another lower buying opportunity 30 days before BTC halving
Ethereum Price Expects a 10% Drop
Ethereum price has fallen below the most critical 61.8% Fibonacci retracement level at $3,365, with eyes now set on the 50% Fibonacci placeholder at $3,137.
As the RSI falls below the mid-level due to the rapid decline in momentum and the AO histogram bars move towards the negative territory, Ethereum price could fall by 10% and find a turning point at around $3,013 before ETH Buying becomes attractive.

ETH/USDT 1-day chart
On the other hand, if bulls increase their buying pressure at current levels, Ethereum price could pull higher and break resistance due to the 78.6% Fibonacci retracement level at $3,691.
A reversal of this hurdle into support would motivate late bulls to buy ETH, with the resulting buying pressure driving ETH price higher and setting a higher high above the market range peak at $4,105. This would represent an increase of 25% above current levels.
Also Read: Ethereum L2 Bridge Deposits Surge After Dencun Upgrade
This bearish divergence could lead to a decline in the XRP price
Ripple price has made higher lows while the RSI has created lower lows, culminating in a possible weakening of momentum or a trend reversal. This suggests that the bullish momentum in XRP price is losing strength as the RSI shows lower values.
Increased selling pressure could cause Ripple price to break below the ascending trendline and potentially fall as low as $0.5500, or in the worst case scenario, take another step lower towards the support level at $0.5368 testing. This would represent a decline of around 11% from current levels.
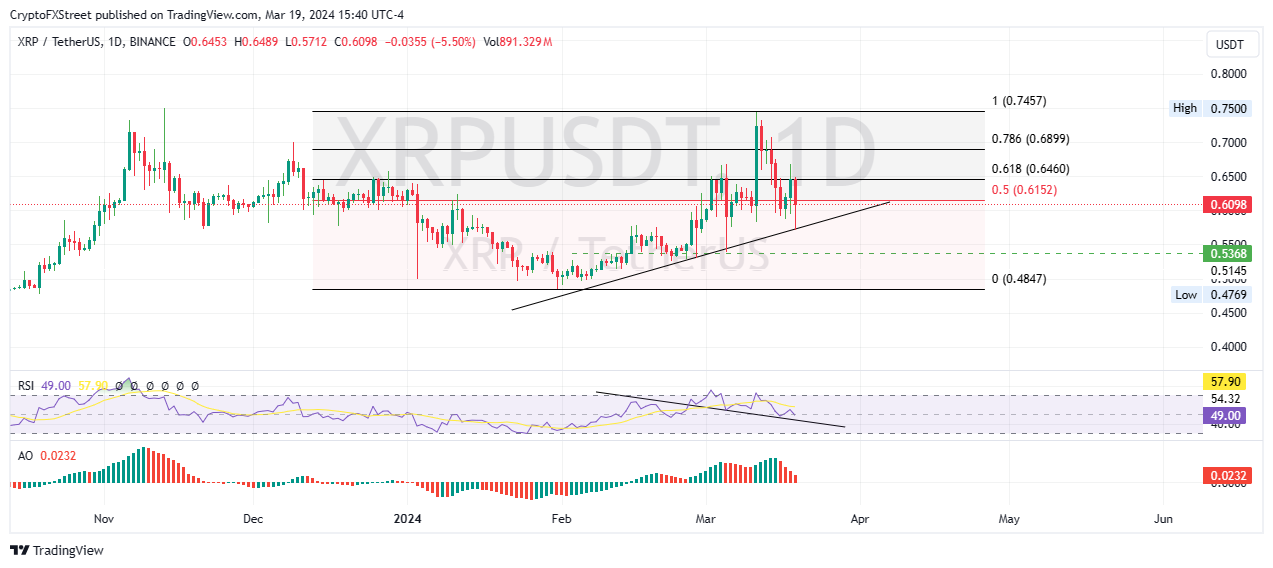
XRP/USDT 1-day chart
Conversely, a recovery by bulls could see XRP price rise back above the 50% Fibonacci placeholder at $0.6152. Increased buying pressure above this level could see the price face the 61.8% Fibonacci retracement level of 0.6460, where strong resistance is expected.
Clearing this level would be the signal the skeptics might need to rally en masse and push the XRP price further higher. This could see XRP price reach the market range peak at $0.7457, a 24% increase from current levels.
Also Read: XRP is trading below the key $0.60 mark with moderate losses
Learn Crypto Trading, Yield Farms, Income strategies and more at CrytoAnswers
https://nov.link/cryptoanswers