


Bitcoin price analysis takes a loss as the price fell to $22,891 today. The downtrend has been fairly constant for the past two days and today the price followed a downward move as well. The trend reversal was quite unexpected as the bulls were leading earlier. Nonetheless, the bears have taken over again and the price has been devalued. The cryptocurrency is down 1.47 percent with a trading volume of $24 billion and a market cap of $441 billion.
Cryptocurrency price heatmap, Source: Coin360
The next resistance for bitcoin is $23,282. However, if BTC price fails to break this resistance, it could continue falling towards the $21,816 point. On the upside, BTC/USD support stands at $22,696. If the bulls manage to push back and the price surges above $22,891, we can expect the price to continue higher. Buying pressure for the BTC/USD pair is still in a rising mode and has supported the price action.
Bitcoin Price Analysis 1-Day Price Chart: Bearish swing lowers the price level to $22,891
1-day bitcoin price analysis shows that the bearish momentum has strengthened over the past few hours. The day before, the price of BTC had made higher highs. However, the bearish momentum today has brought the price level down to $22,891. Currently, the bulls are attempting to regain control but the resistance at $23,282 is proving too strong.
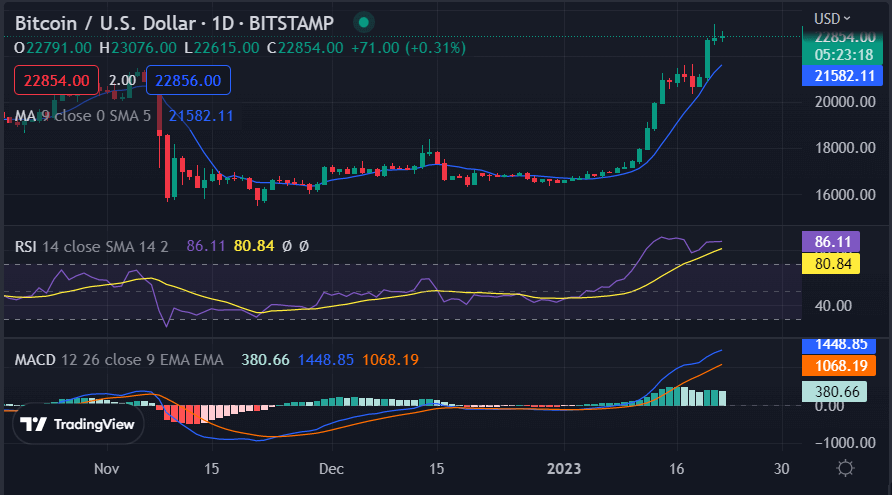 BTC/USD 1-day chart Source: TradingView
The Relative Strength Index (RSI) is currently at 80.84 and is trending sideways. This suggests that the market is currently in a consolidation phase and any breakout can cause a strong move in either direction. The Moving Average Convergence Divergence (MACD) has been on a bearish ride as the MACD line is below the signal line. The MACD histogram indicates that the bears have taken control of the BTC price action. The moving average indicator is showing bearish pressure in the market at $21,582.
Bitcoin price analysis on a 4-hour price chart: Bearish depression causes the price to fall below $22,891
Bitcoin’s 4-hour price analysis is showing signs of bearish momentum as the price has dropped quite a bit. The price has steadily declined as the cryptocurrency shows a downtrend. A drop in price was recorded in the last four hours and the price level dropped to $22,891. Further, the moving average indicator is showing its value at the time of writing at $22,898.
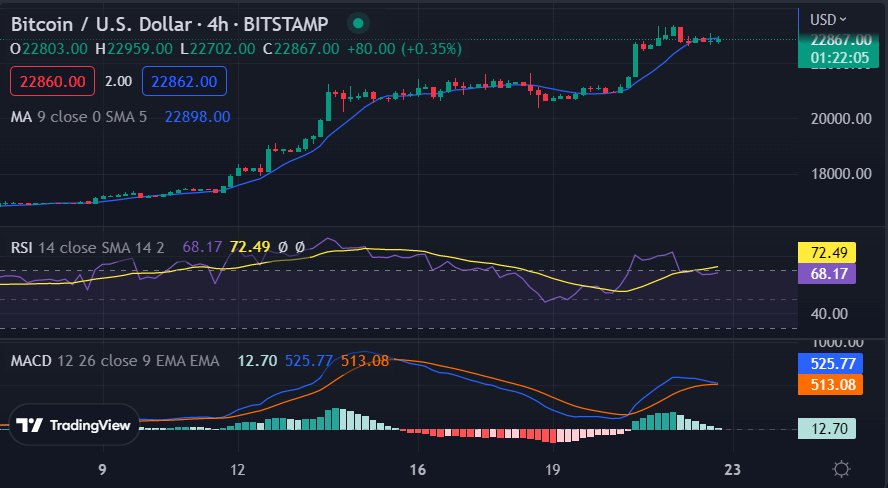 BTC/USD 4 hour chart Source: TradingView
The convergence/divergences of the 4-hour moving average also indicate a downtrend. The MACD indicator is currently at 525.08, which is below the signal line. This clearly indicates a bearish trend and the bears are still controlling the market at $22,891. Apart from that, the RSI indicator has seen a bearish decline as its level currently stands at 72.49.
Bitcoin price analysis conclusion
In conclusion, the Bitcoin price analysis shows that a downtrend has started since earlier today. The bears are leading the game at the moment and the price level has been lowered to $22,891 as a result. Another decline is to be expected as the bears have been dominant for the past few hours as well. The price is steadily moving lower, which means that the bulls’ chances for improvement are still limited.
While you wait for bitcoin to keep moving, check out our price predictions for XDC, Cardano, and Curve
Learn Crypto Trading, Yield Farms, Income strategies and more at CrytoAnswers
https://nov.link/cryptoanswers
Comments are closed.