


- Bitcoin price is showing weakness as the weekly bearish breaker is retested, which is raising doubts among investors.
- Even if the optimistic outlook has not yet been invalidated, market participants must be cautious.
- If the bulls persist, BTC could retest the mid-breaker and hit the highs of $35,260 and $41,273, respectively.
Bitcoin price is showing a bearish breaker setup on the weekly timeframe, suggesting that buyers need to be cautious. This signal is ambiguous as it does not yet accurately predict a reversal. Therefore, a continuation of the ongoing BTC rally in 2023 is still possible.
Read more: Is the alternative season in jeopardy as Bitcoin slips below $30,000?
Bitcoin price is losing directional tilt
Bitcoin price seems to have formed a definitive bottom in the last quarter of 2022, which has led to an explosive rally. BTC’s year-to-date performance is 70%, with a local top of $30.968.
The latest surge in bitcoin price pushed it into a weekly bearish break that stretched from $29,247 to $41,273. As detailed in a previous article, a bearish breaker setup is a zone where the asset faces high selling pressure.
The technical formation revolves around two higher highs and the lower candle between those tops. After the second higher high is formed and the asset starts to retrace, investors need to pay attention to how the price reacts to the last lower candle. If the rapid collapse of the valley leads to the formation of a new lower low, this will confirm the formation of a bearish breaker.
Now market participants have to wait for the asset to pull back and retest the breaker to open short positions.
What are breaker setups?
As mentioned above, bitcoin price has already started to experience immense selling pressure after venturing into the bearish breaker. In fact, BTC has erased last week’s gains and is currently at $28,237.
There are two paths Bitcoin price can take from here:
- A resumption of the bull run extending the rally, followed by and possibly forming a local high in the mid-breaker at $35,260 or the high of the range at $41,273.
- If bitcoin price continues higher, it will encounter a confluence of Fair Value Gap (FVG) and the midpoint of the bearish breaker. The FVG highlighted in orange ranges from $34,277 to $37,406, which is a perfect spot to book profits and anticipate a local top formation. If BTC surges higher, it is likely to top out at $41,273, which is the breaker’s cap.
The second path is a stairway to the ground floor, aka a continuation of the bears’ ongoing attempt to push BTC lower. In this case, the bitcoin price will target the weekly FVG and extend from $26,591 to $22,591. Interestingly, this area of inefficiency contains two critical support floors at $26,591 and $22,591, where long-term holders are likely to start their accumulation.
The seemingly pessimistic outlook described in the second point is not really bearish, especially for long-term holders. For a detailed macro analysis of Bitcoin technicals, see the article attached below.
Assessing the local bitcoin price peak from a macro perspective
BTC/USDT 1 week chart
Despite the ongoing bearish outlook, on-chain metrics could paint a less ambiguous picture and provide a direction for the next bitcoin price move.
Deciphering directional distortion clues using on-chain metrics
IntoTheBlock’s Global In/Out of the Money (GIOM) model shows that the northbound move in bitcoin price has been relatively less crowded. As seen in the image below, about 2.3 million addresses that bought 1.08 million BTC at an average price of $30,392 are “out of the money.”
This cluster is followed by another where 4.77 million addresses that have accumulated 1.95 million BTC at an average price of $39,332 are underwater. The second group of “out of the money” holders is likely to pose a significant selling threat, which due to sheer size could result in a local top formation as opposed to the first.
Another credibility of the long-term bullish thesis for bitcoin price is the support cluster stretching from $23,039 to $28,107 where nearly 3.7 million addresses bought 1.86 million BTC at an average price of $25,433. These investors are likely to accumulate more BTC should the price fall.
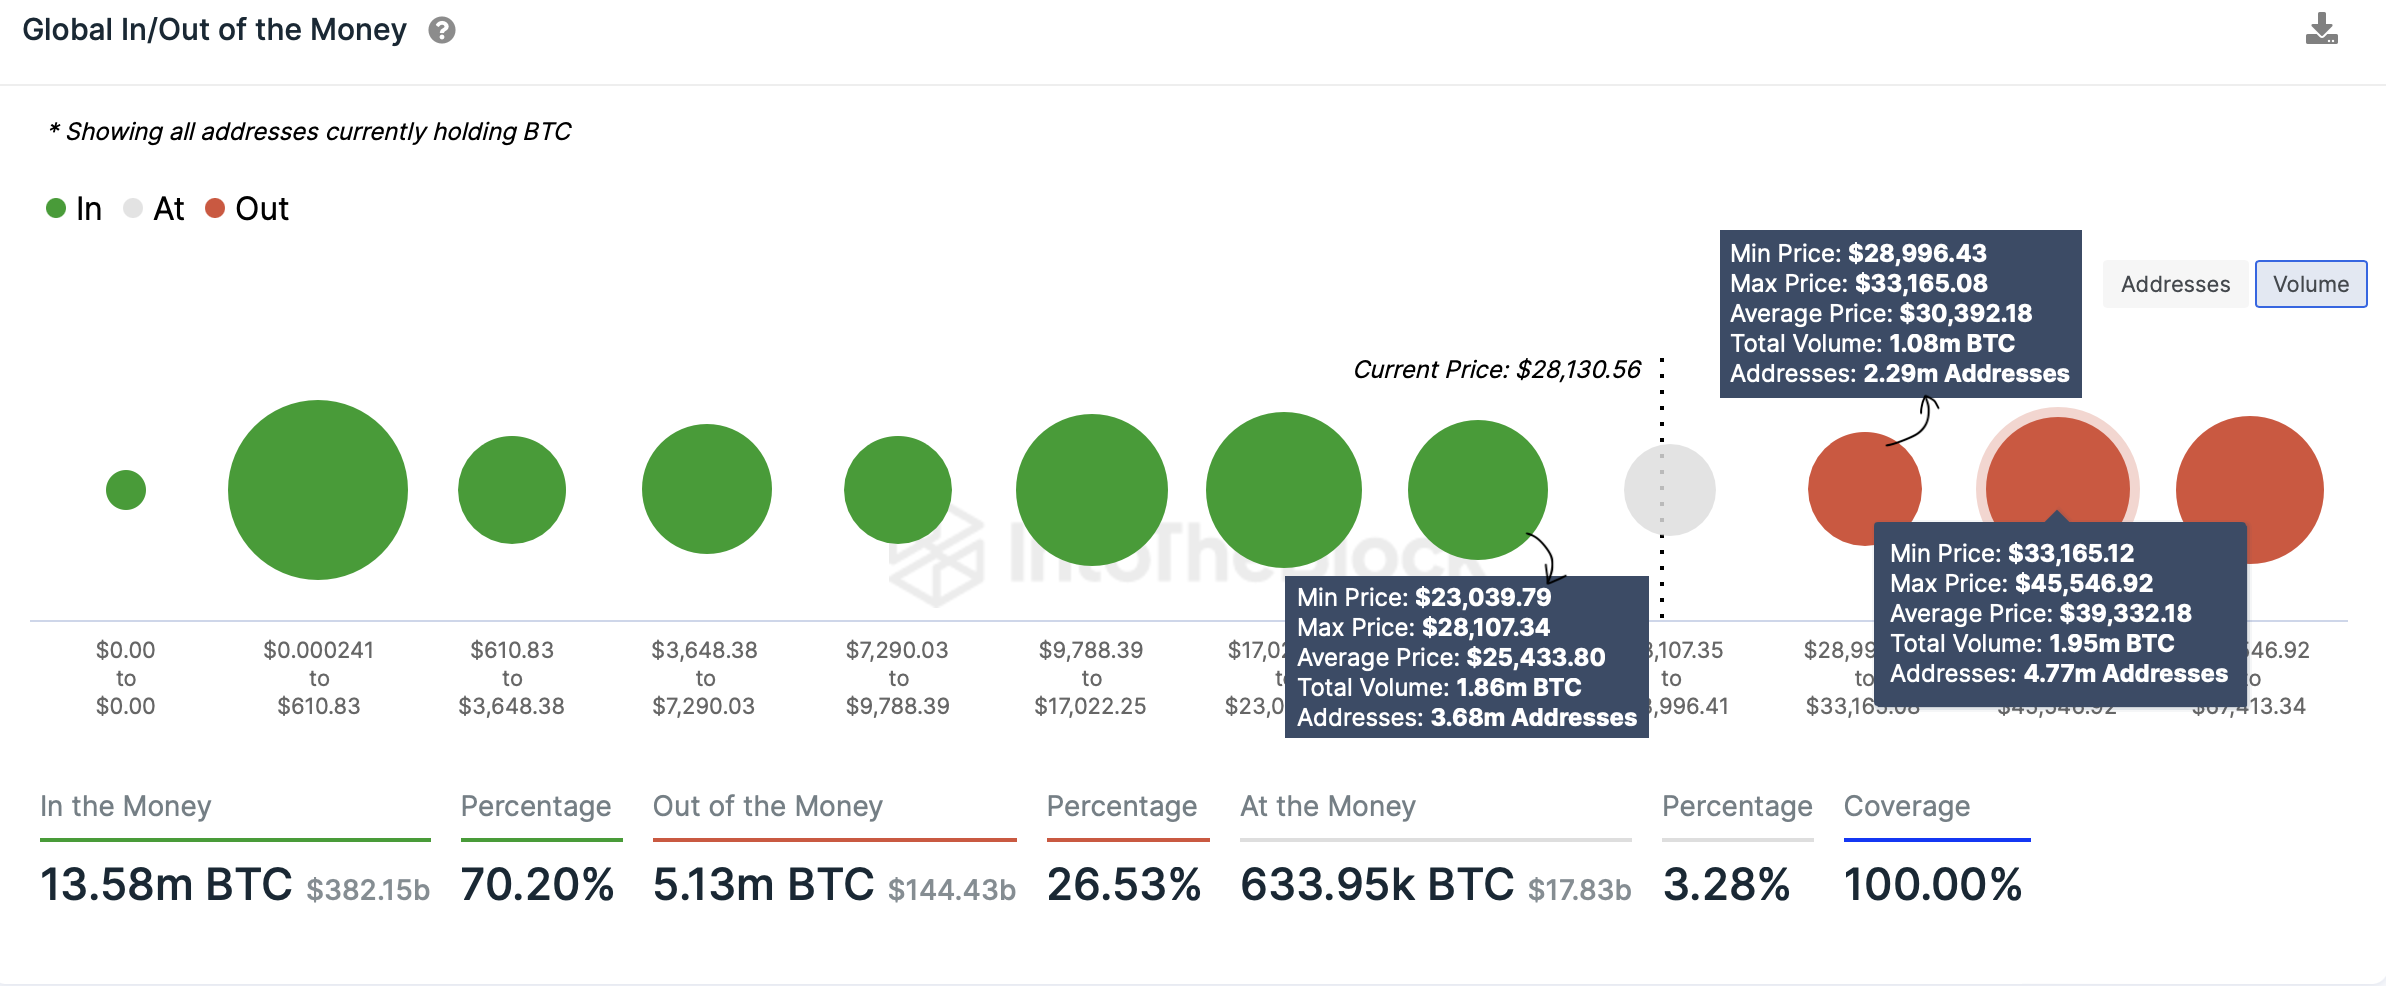
BTC GIOM
While GIOM provides a detailed view of key levels, it does not provide directional alignment. Even now, bitcoin price could go either way. Let’s take a look at the Daily Active Addresses (DAA) metric. As of January 2023, the number of active participants interacting with the Bitcoin blockchain has remained over 1 million.
After a brief dip on March 27th, this metric has produced higher highs and is not yet showing any sign of weakness. Further examination of this indicator will be helpful in determining if investors are exiting the network, which could indicate capital flight and potentially signal a reversal.
%20[16.03.46,%2021%20Apr,%202023]-638176753515438507.png)
Daily active BTC addresses
Although the DAA metric provides a bullish bias, it should not be used as a standalone metric as it does not give users a complete picture. Whale Transaction Count is another important metric that can be used to determine what smart money investors are doing.
This indicator tracks transactions of $100,000 or more and spikes in this index can be used to time local highs and lows. On April 11, this metric posted an unusual surge that propelled it from around 1,700 to 3,200 after Bitcoin’s price surged from $27,900 to $30,000, which could indicate these investors are looking to sell and book profits.
The surge in DAA combined with the unusually high number of whale transactions clearly indicates that a bearish outlook is ongoing.
%20[16.17.27,%2021%20Apr,%202023]-638176753871204300.png)
Number of BTC whale transactions
Finally, we can see from the Supply Distribution chart that wallets holding between 100 and 1,000 have increased from 19.97% on April 18th to 20.07% on April 21st, showing that this cohort of BTC holders has accumulated.
However, the same cannot be said about the 1,000 to 10,000 BTC holders. These investors began dumping their stash after the April 20 crash. This metric is currently not helping to analyze the directional bias, perhaps it could signal a unified outlook from long-term holders with the weekly close and the start of a new week when the second category of investors begins to accumulate. In such a case, it could indicate a bullish outlook and help set Bitcoin’s direction, but there isn’t enough data to judge that at the moment.
%20[16.11.13,%2021%20Apr,%202023]-638176753658095837.png)
BTC supply distribution chart
Learn Crypto Trading, Yield Farms, Income strategies and more at CrytoAnswers
https://nov.link/cryptoanswers
Comments are closed.