


- Bitcoin price on the weekly time frame predicts a possible correction to $34,000.
- There was also a triple bearish divergence on the daily chart, which mirrors the sell signal on the weekly chart.
- While the short-term outlook hopes for a correction, the long-term outlook remains optimistic.
The price of Bitcoin (BTC) is showing signs of slowing after Thursday’s sudden selloff that wiped out more than a billion dollars in open interest and hundreds of millions in liquidations. While this caused many altcoins to suddenly experience double-digit declines – before quickly recovering – others remain under enormous selling pressure. Despite the recent debacle, investors remain optimistic and expect the rally to continue in 2023.
Read more: Breaking News: Bitcoin price crashes 8%, wiping out $1 billion in open interest
Bitcoin spot ETF approval window
The approval of a spot Bitcoin ExchangeTraded Fund (ETF) is on everyone’s lips in 2023. After several delays and no-shows, Grayscale’s victory against the US Securities and Exchange Commission (SEC) has increased its chances of approval. which even suggests it could be accelerated.
The ETF approval window opened on November 8th and runs until November 17th.
As described by Bloomberg research analyst James Seyffart, the “ETF window” is when the SEC must issue rebuttal comments on delays or rejections of ETF applications. The regulator, which had previously rejected the ETF applications of all twelve applicants, is now ready to submit counter comments or approve them.
In a recent note, James Seyffart added:
A short window opens on November 9th during which the SEC may approve all 12 U.S. spot Bitcoin ETF applicants, including Grayscale’s GBTC. It will be open for at least eight days. Even if no approvals arrive this month, we still believe there is a 90% chance of approval by January 10th.
Experts argue that if approval actually comes, it will be for all twelve applicants. However, a positive aspect of this development is that despite the ETF approval, it will take at least a month for the spot ETF to hit the market.
ETF window or not, Bitcoin price has risen in anticipation of this approval.
Also Read: Ethereum price breaks $2,000 as BlackRock hints at filing for spot Ether ETF
BTC is the frontrunner in ETF approval
Bitcoin (BTC) price has been at the forefront of ETF approval news, leading to a 121% year-to-date return. It will likely do the same in the future, especially given the SEC’s position and the ETF approval window.
On November 9th, there was a sudden 6% sell-off that wiped out $1.6 billion in open interest. In total, liquidations on November 9th totaled nearly $500 million, according to data from CoinGlass.
BTC OI, full crypto liquidations
Read more: Top 3 Price Prediction Bitcoin, Ethereum, Ripple: $40,000 is achievable for BTC as speculators discover BTC ETF at the forefront
Weekly BTC chart predictions pause in uptrend
On the weekly chart, Bitcoin price has completely closed the fair value gap (FVG), which stretches from $34,243 to $37,386. Interestingly, this gap forms around the middle of the weekly bearish breaker, which ranges from $28,805 to $41,330.
The fair value gap occurs when there is a sudden price movement in one direction. The FVG is filled to ensure balanced price delivery.
The bearish breakout is a reverse demand zone where trapped bulls look for an exit. Therefore, a retest of the demand zone from below is likely to trigger a selling frenzy. The same can be seen on the weekly chart, where the first and second retests of this weekly breaker resulted in corrections of almost 20% in April and June.
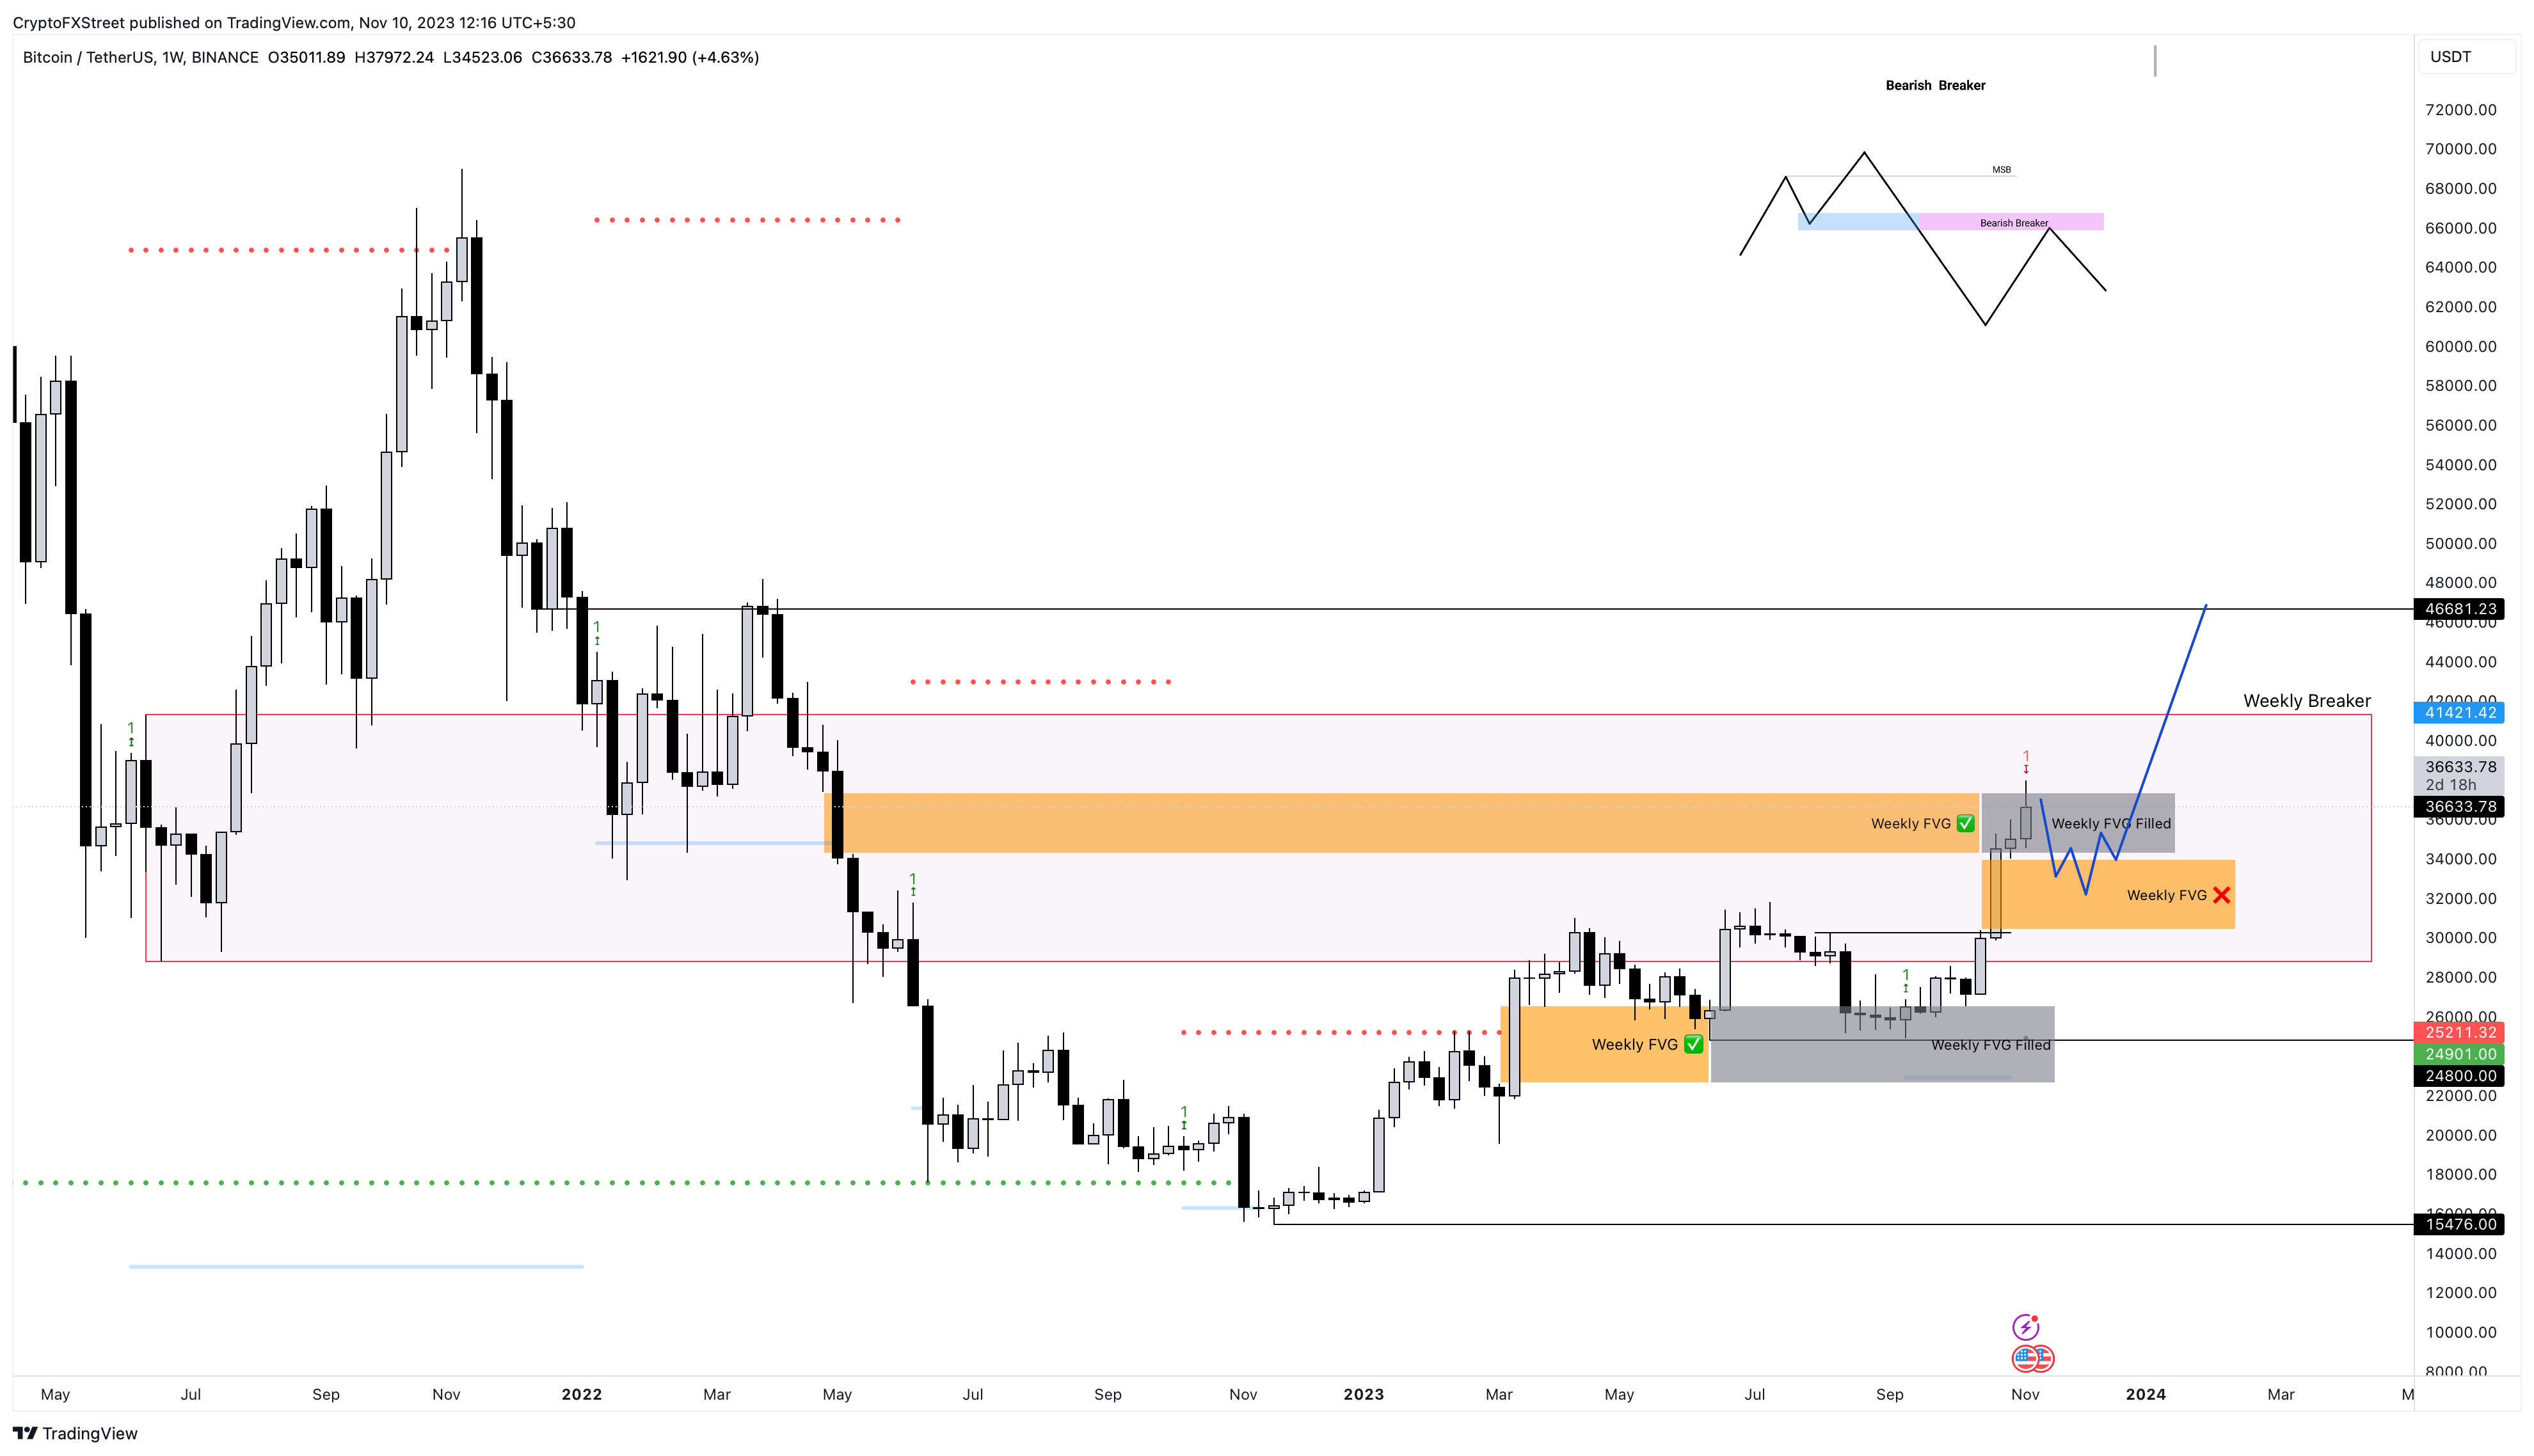
BTC/USDT 1-week chart
News of the ETF approval wiped out the selling pressure from the weekly breaker, driving Bitcoin price to $38,000. Although unlikely, a lack of reaction from the SEC or delays in ETF approval could cause BTC to decline.
The Momentum Reversal Indicator (MRI), which has shown a red “one” sell signal, adds additional credibility to the potential pullback scenario. This setup predicts one to two downward candlesticks.
After the COVID crash in March 2020, BTC recovered 174% from the low of $3,782 and reached a local high of $10,380. The MRT produced a similar red “one” sell signal that resulted in a 15% drop from the top and created a higher low at $8,833. The upward trend then continued.
The current outlook for BTC looks similar. If history repeats itself, Bitcoin price could rise back to $34,000. Interestingly, this level coincides with the newly created FVG and ranges from $30,379 to $34,025.
A bounce in this area could be crucial to initiate the next phase of the bull rally. In such a case, Bitcoin price could easily reach the psychological $40,000 mark. Beyond this hurdle lies $46,680, which represents another key resistance barrier that BTC bulls must overcome.
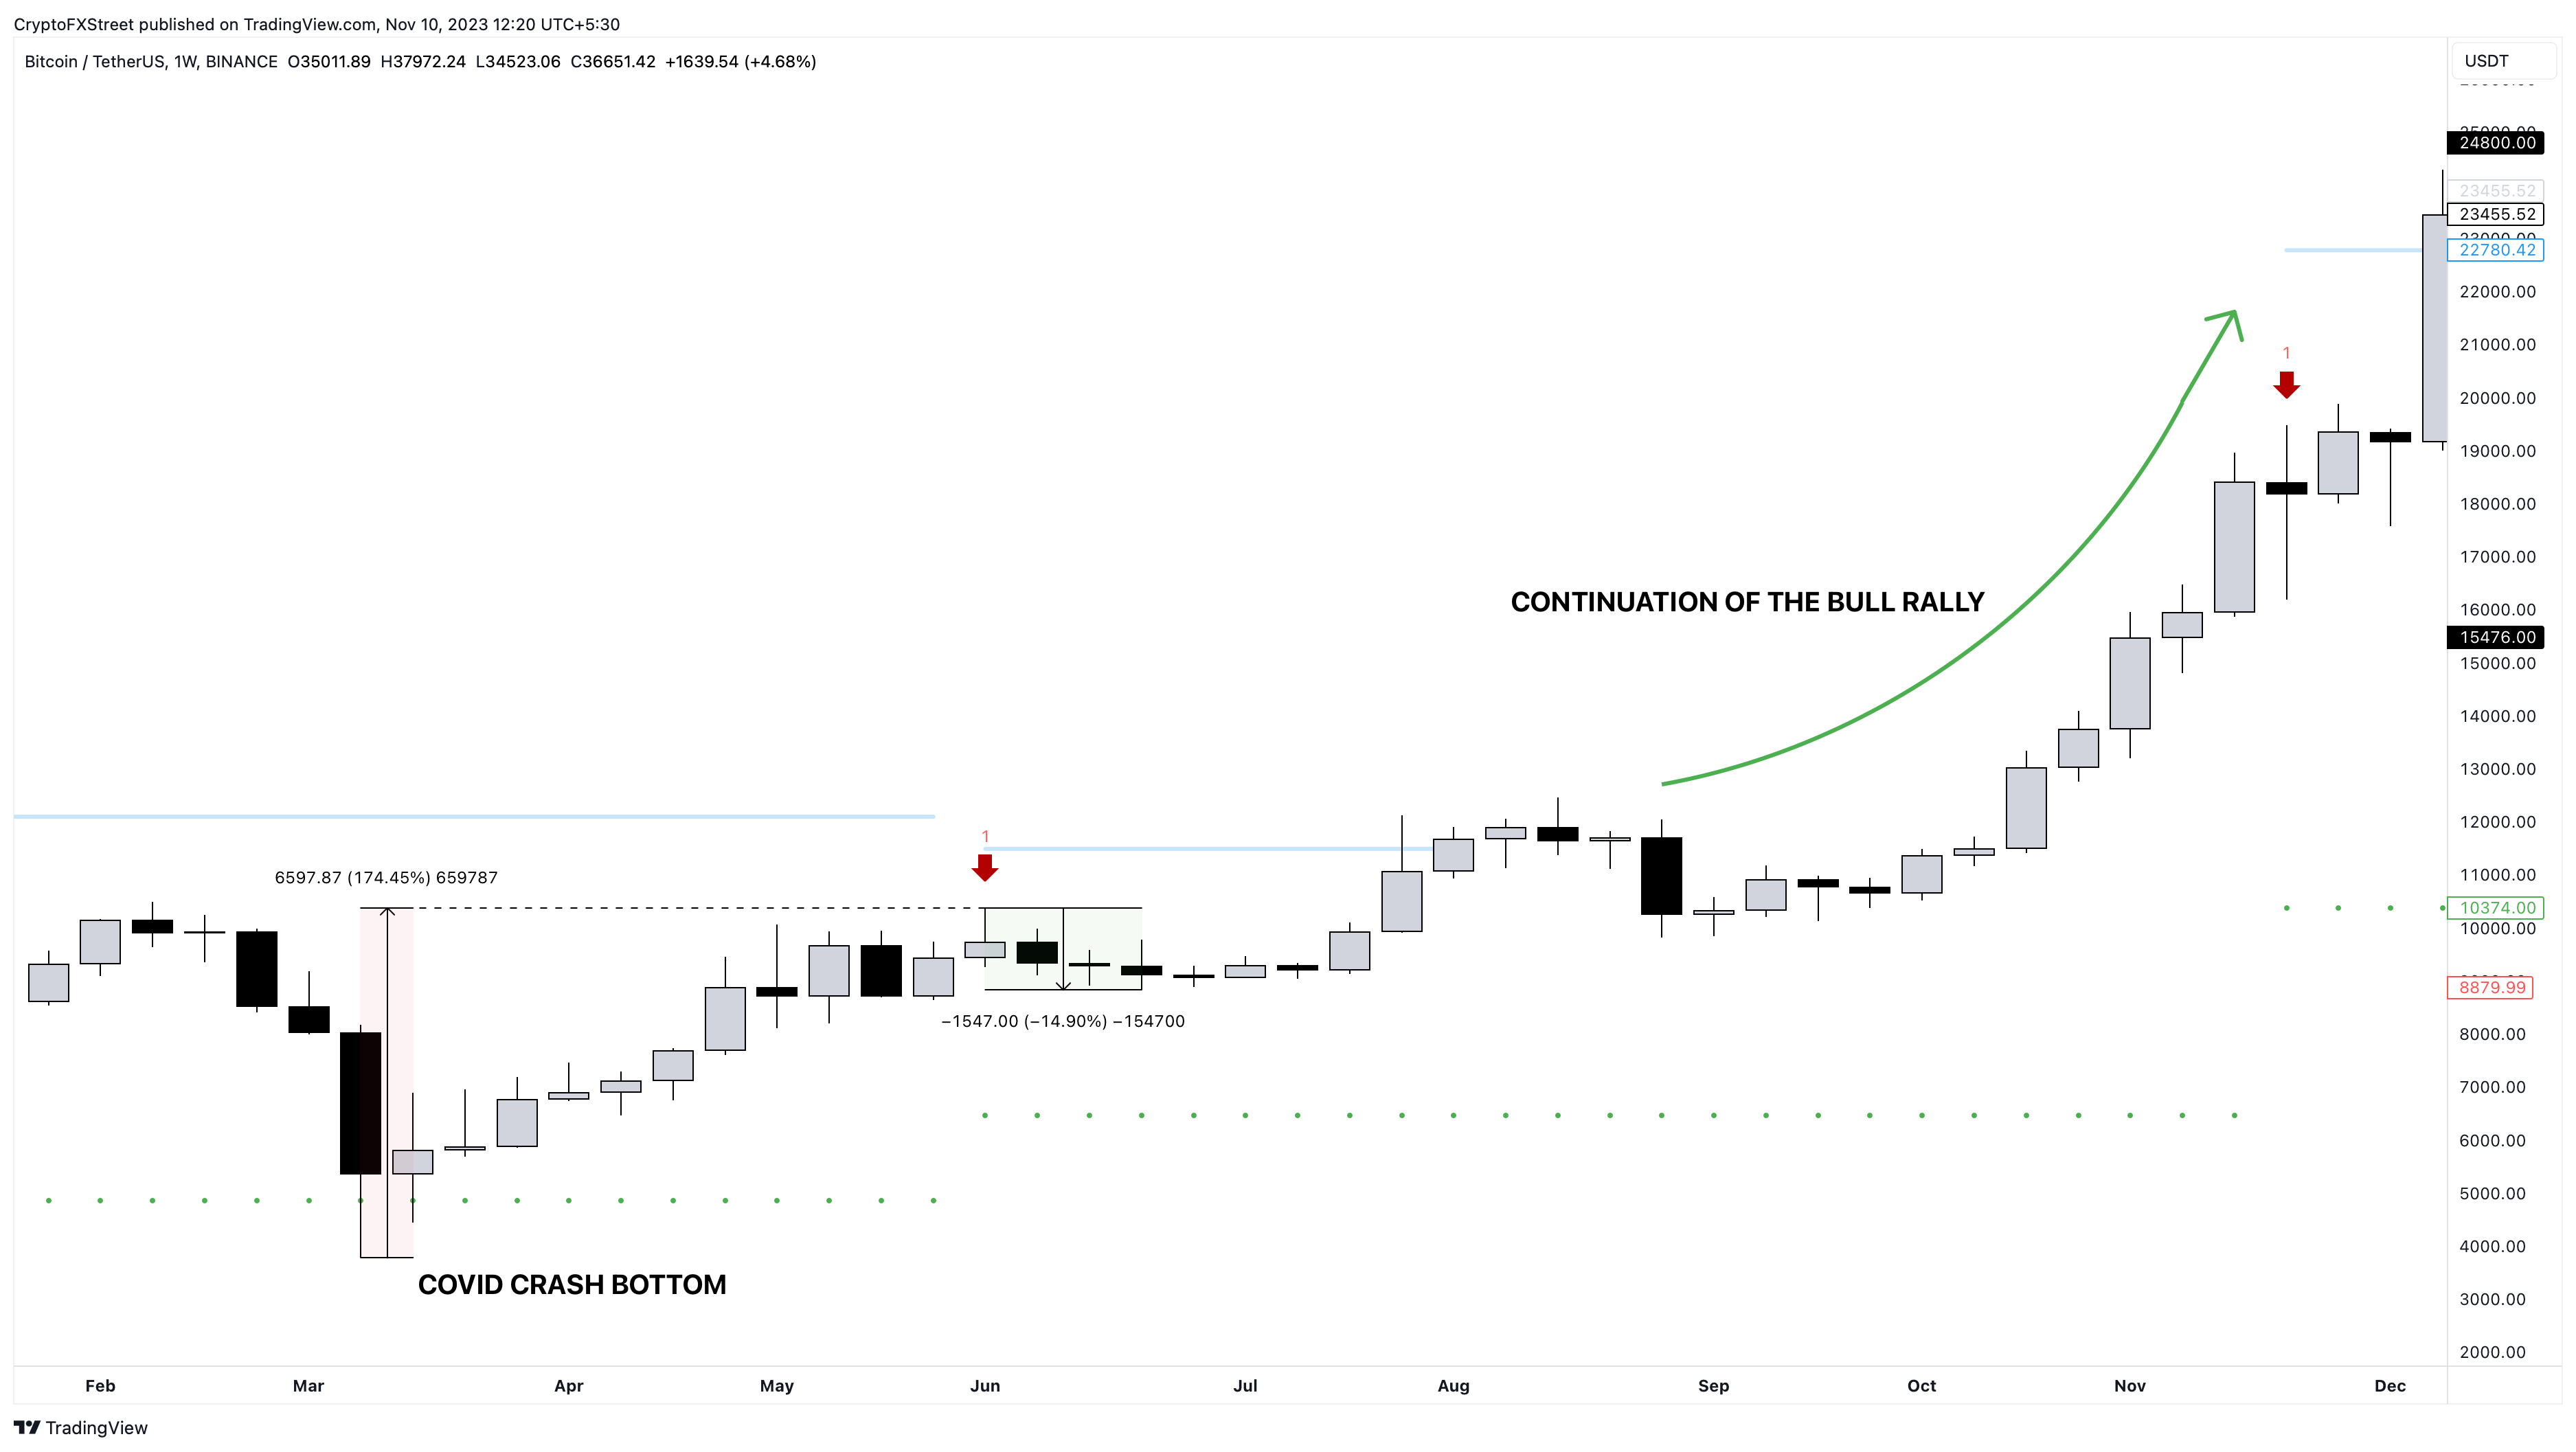
BTC/USDT 1-week chart
The daily BTC chart suggests an impending correction
On the daily chart, Bitcoin price has made three higher highs that are not confirmed by the Relative Strength Index (RSI). This nonconformity is called bearish divergence and often results in a decline in the price of the underlying asset.
The probability of a triple divergence is higher if the upcoming daily candlestick closes are below $37,000. Assuming this prediction comes to pass, investors can expect BTC to target sell-side liquidity (SSL) below the swing lows formed since October 27th. This move should bring BTC down to around $34,000.
In a dire case where panic selling occurs, Bitcoin price could slide into the daily FVG ranging from $30,229 to $32,833. As can be seen in the chart below, the weekly support level at $31,767 is a good confluence for buying declines.
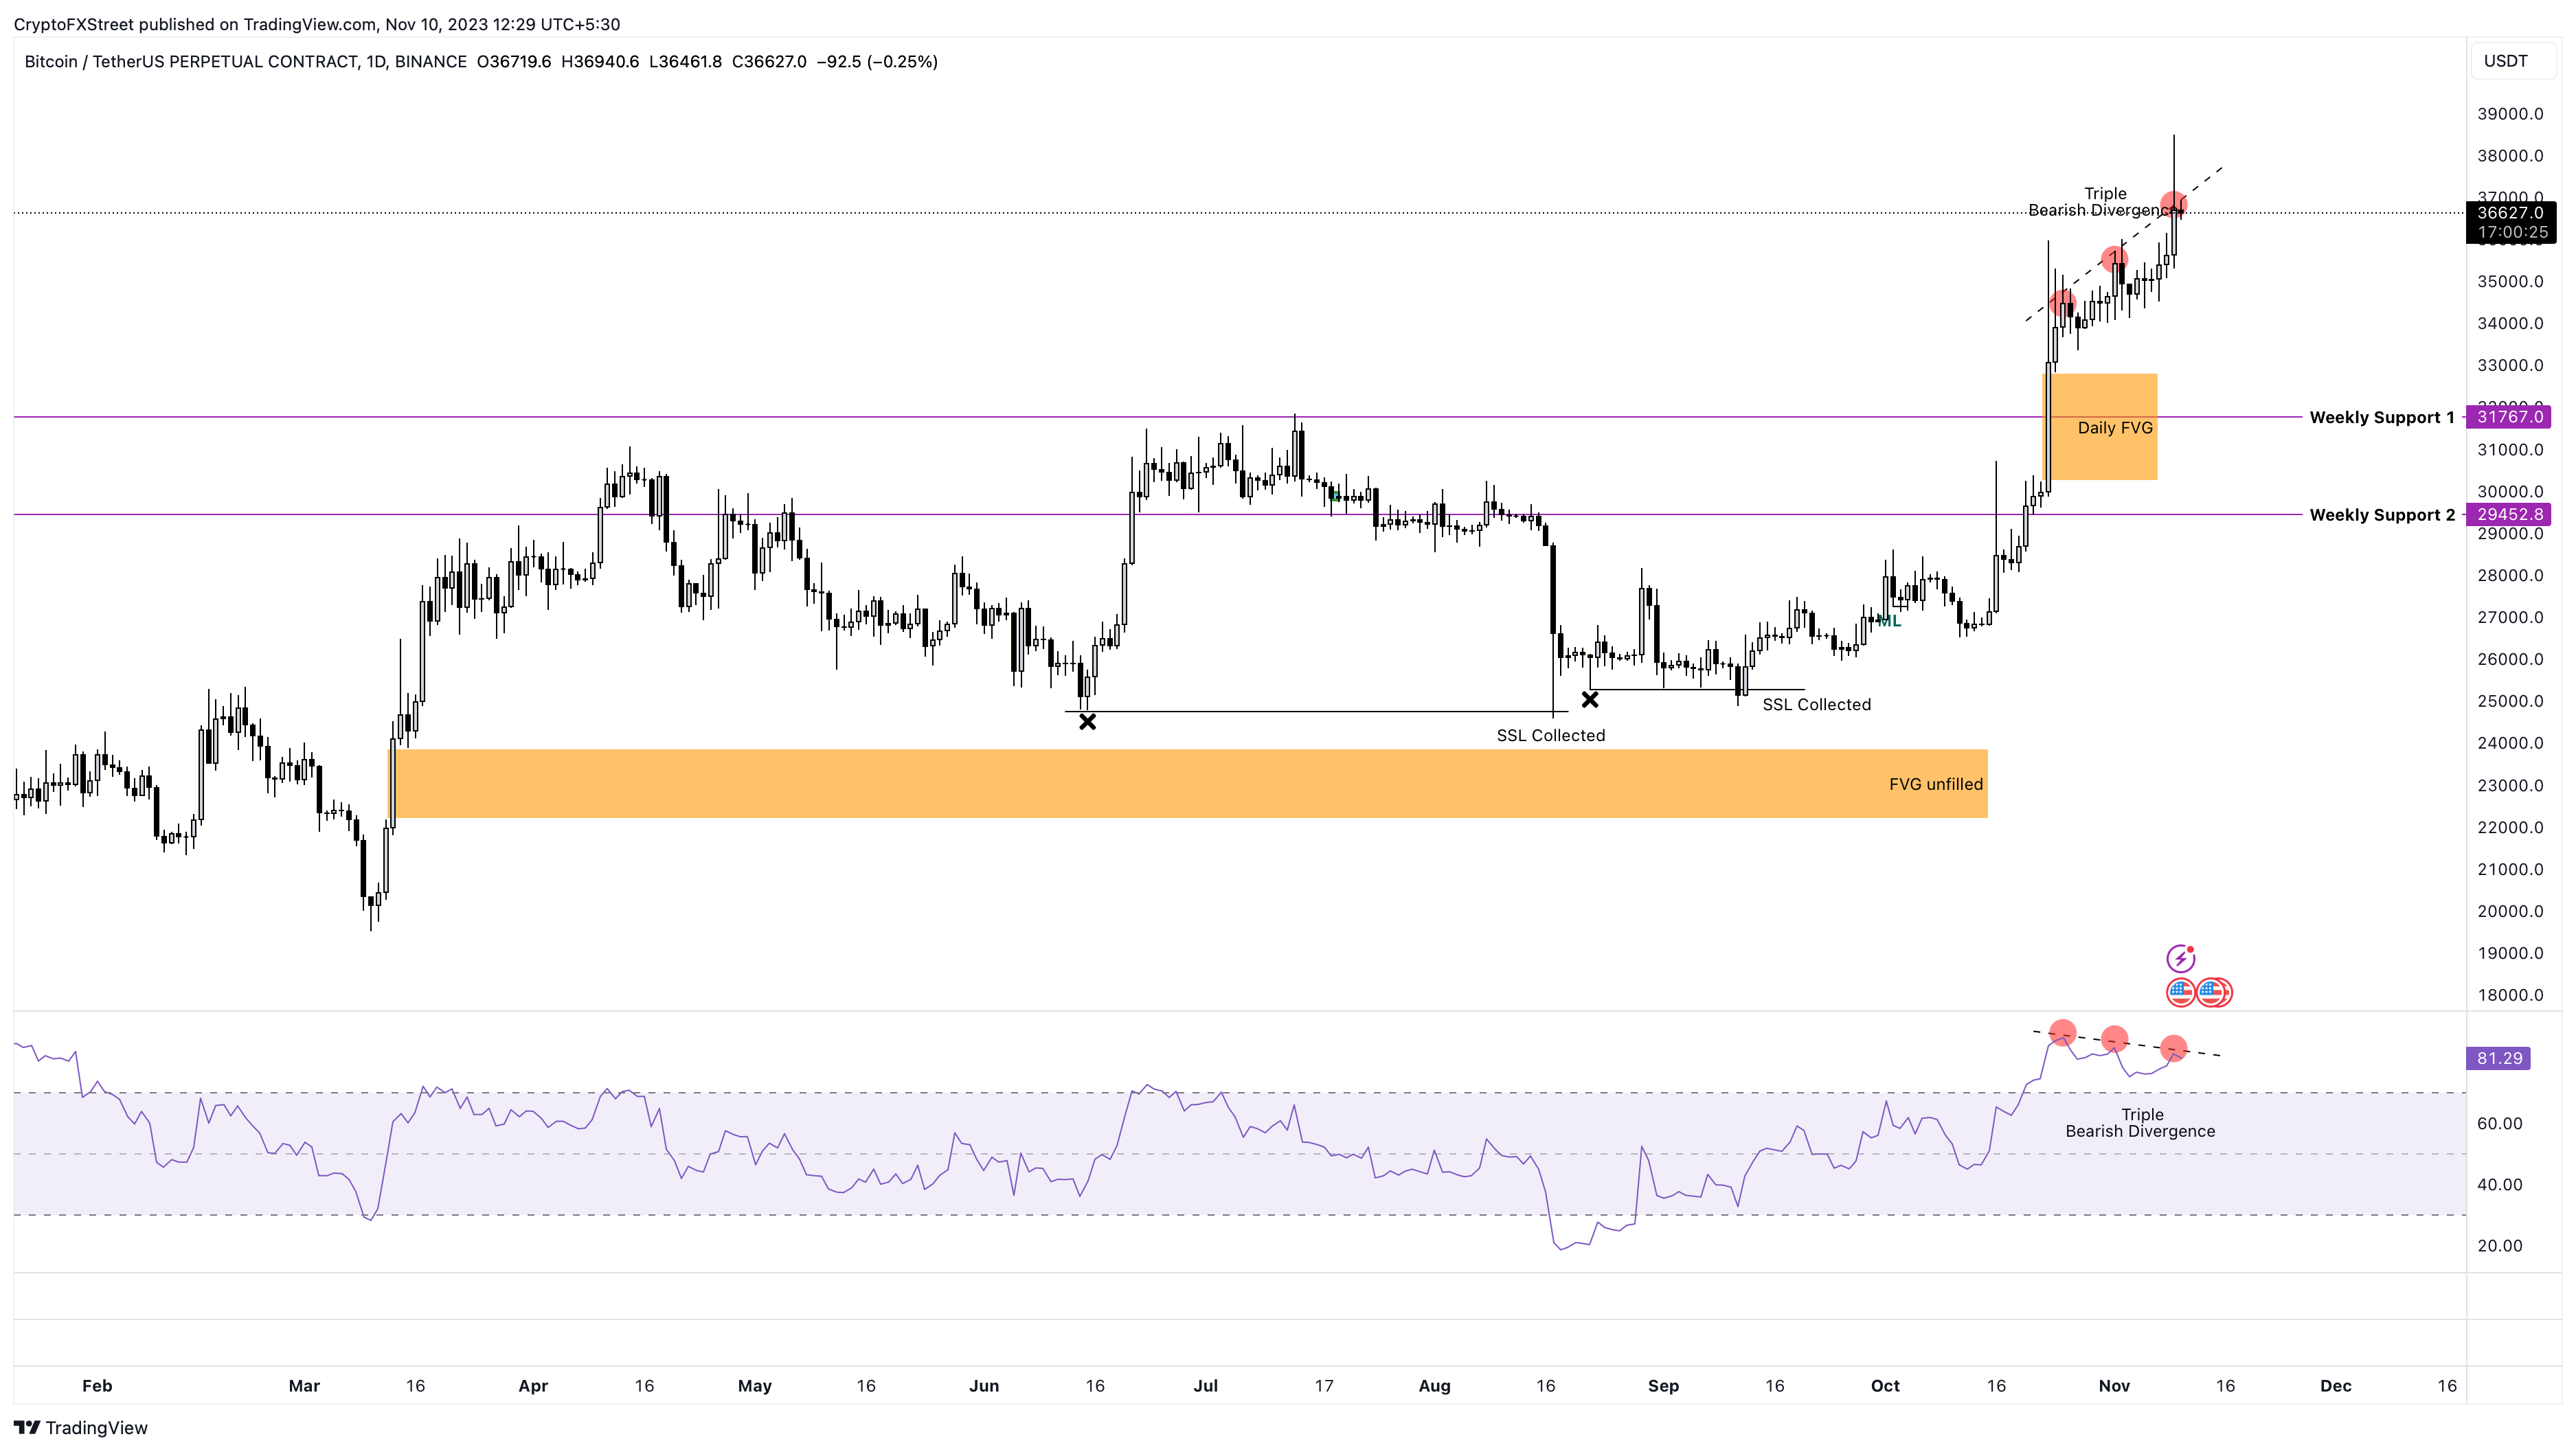
BTC/USDT 1-day chart
Invalidation scenarios
Below are devaluation scenarios that would bypass the short-term sell signal and lead directly to an uptrend continuation:
- The US SEC approves all 12 ETF applications submitted in the ETF window described above: This scenario will not only push BTC over the $38,000 hurdle, but also push it to $45,000 or more. Such a scenario would even have enough FOMO to push BTC to levels where it challenges 2021 highs of $60,000.
- A daily candlestick close above $38,000 invalidates the bearish divergence sell signal: This outlook will weaken the short-term sell signal and result in one of two things – a sideways move or a slow increase until news flow to ETFs dies down.
Learn Crypto Trading, Yield Farms, Income strategies and more at CrytoAnswers
https://nov.link/cryptoanswers