


Bitcoin price reached highs of nearly $50,000 per coin this year until an abrupt 15% sell-off halted the advance and put the overheated crypto market on ice. The pullback has caused BTCUSD to trigger an early “top” warning signal, but data suggests the top cryptocurrency could double before the actual peak is reached.
Fishing for a top signal using the Fisher transform
The spot BTC ETF hype helped drive the price of Bitcoin from lows around $15,000 to over $45,000 per coin – a 300% increase. The peak price following the ETF approval reached as high as $49,000 before a sharp rejection caused BTC to fall back to $42,000, where it is currently trading.
The 15% correction after a significant rise is not too unusual, but the 1W Fisher Transform indicator may have just given an early “top” signal. The tool, which smoothes price movements to better visualize price extremes, achieved a standard deviation of +6. This is one of the most extreme readings the tool has ever produced for the time frame.
However, what is more important is how the technical indicator has behaved in recent years. Notably, the Fisher transform on the weekly time frame accurately identified the 2019 peak and the 2021 peak several weeks in advance after reaching a standard deviation of +6.
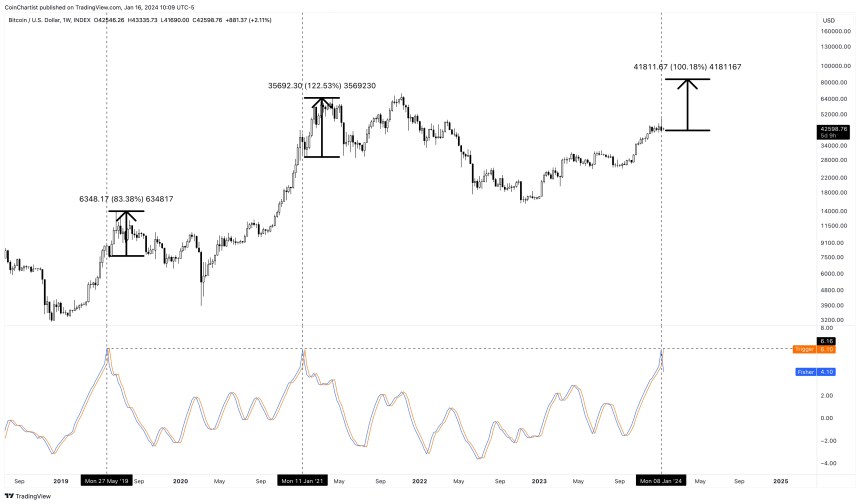
Is BTC about to double soon? | BTCUSD on TradingView.com
Why this warning signal could mean a new high and a 100% rally
This signal was an early peak warning, not the actual peak, to be precise. In 2019, after the Fisher transformation broke through the downtrend, BTCUSD rallied another 83% before reaching the actual peak. In 2021, another 122% more ROI needed to be achieved before the peak was reached.
This could mean that while Bitcoin price could soon reach a peak, the cost per coin could increase by another 100%. At $42,000 per coin, this could take BTC above $84,000 and to new all-time highs.
It's worth noting that 2021 exceeded 2019's ROI, which could indicate increasing returns as more participants become aware of Bitcoin. With institutions now getting involved, spot ETFs being actively traded, and much more, anything is possible.
This chart was originally featured in issue #32 of CoinChartist VIP: This Time It's Different.
Learn Crypto Trading, Yield Farms, Income strategies and more at CrytoAnswers
https://nov.link/cryptoanswers
Comments are closed.