


Bitcoin Cash (BCH) has seen an extraordinary price surge, up 75% in just a week. This notable surge was accompanied by a substantial inflow of $1.2 billion in trading volume.
Bitcoin Cash’s recent notable uptrend is largely due to its listing on the EDX exchange.
EDX is a trading platform powered by well-known financial institutions such as Fidelity, Schwab and Citadel.
This listing has fueled market interest and has seen the value of Bitcoin Cash surge over the past three days, posting a notable surge of over 50%.
As Bitcoin Cash maintains its uptrend, investors are closely watching the triggers of this surge and its price prediction.
Bitcoin Cash (BCH) is seeing a spike in open interest, fueling hopes of institutional adoption
According to Coinalyze, Bitcoin Cash (BCH) open interest is up an impressive 77% to hit a nine-month high of $135 million.
This sharp rise suggests a shift in positive sentiment towards BCH, which is being driven by anticipation of a possible institutional takeover post-listing on EDX.
Bitcoin Cash was created in July 2017 through a fork from the original Bitcoin blockchain. It saw a notable surge during the 2017 bull market, hitting a record high of $2,947.
However, compared to its counterpart Bitcoin, Bitcoin Cash faced the challenge of achieving widespread adoption as a payment network.
In the past week, the total value of Bitcoin Cash transactions exceeding $100,000 has reached a whopping $129 million.
In contrast, Bitcoin has processed a staggering $75 billion worth of transactions over the same period.
These numbers highlight the differences in transaction volume between the two cryptocurrencies.
The surge in open interest suggests growing optimism about the future of Bitcoin Cash, particularly with regard to institutional adoption.
Increasing confidence from institutional investors is expected to have a positive impact on BCH’s liquidity, market demand and overall value.
Bitcoin Cash price prediction
Analysis of Bitcoin Cash (BCH) price action shows a clear break above the double resistance level at $120.
Previously, there was a strong uptrend that broke the $163.17 obstacle, which is also supported by the 23.6% Fibonacci level.
The daily time frame is pointing to a solid bullish candlestick pattern, indicating high buying interest from investors.
As a result, BCH has surged towards the key $200 resistance level. Although this level has yet to be broken, minor corrections could result in a drop towards the $163 level.
Additionally, the Relative Strength Index (RSI) and Moving Average Convergence Divergence (MACD) indicators are currently in overbought territory on the daily time frame. This suggests that the bullish momentum may have been exhausted.
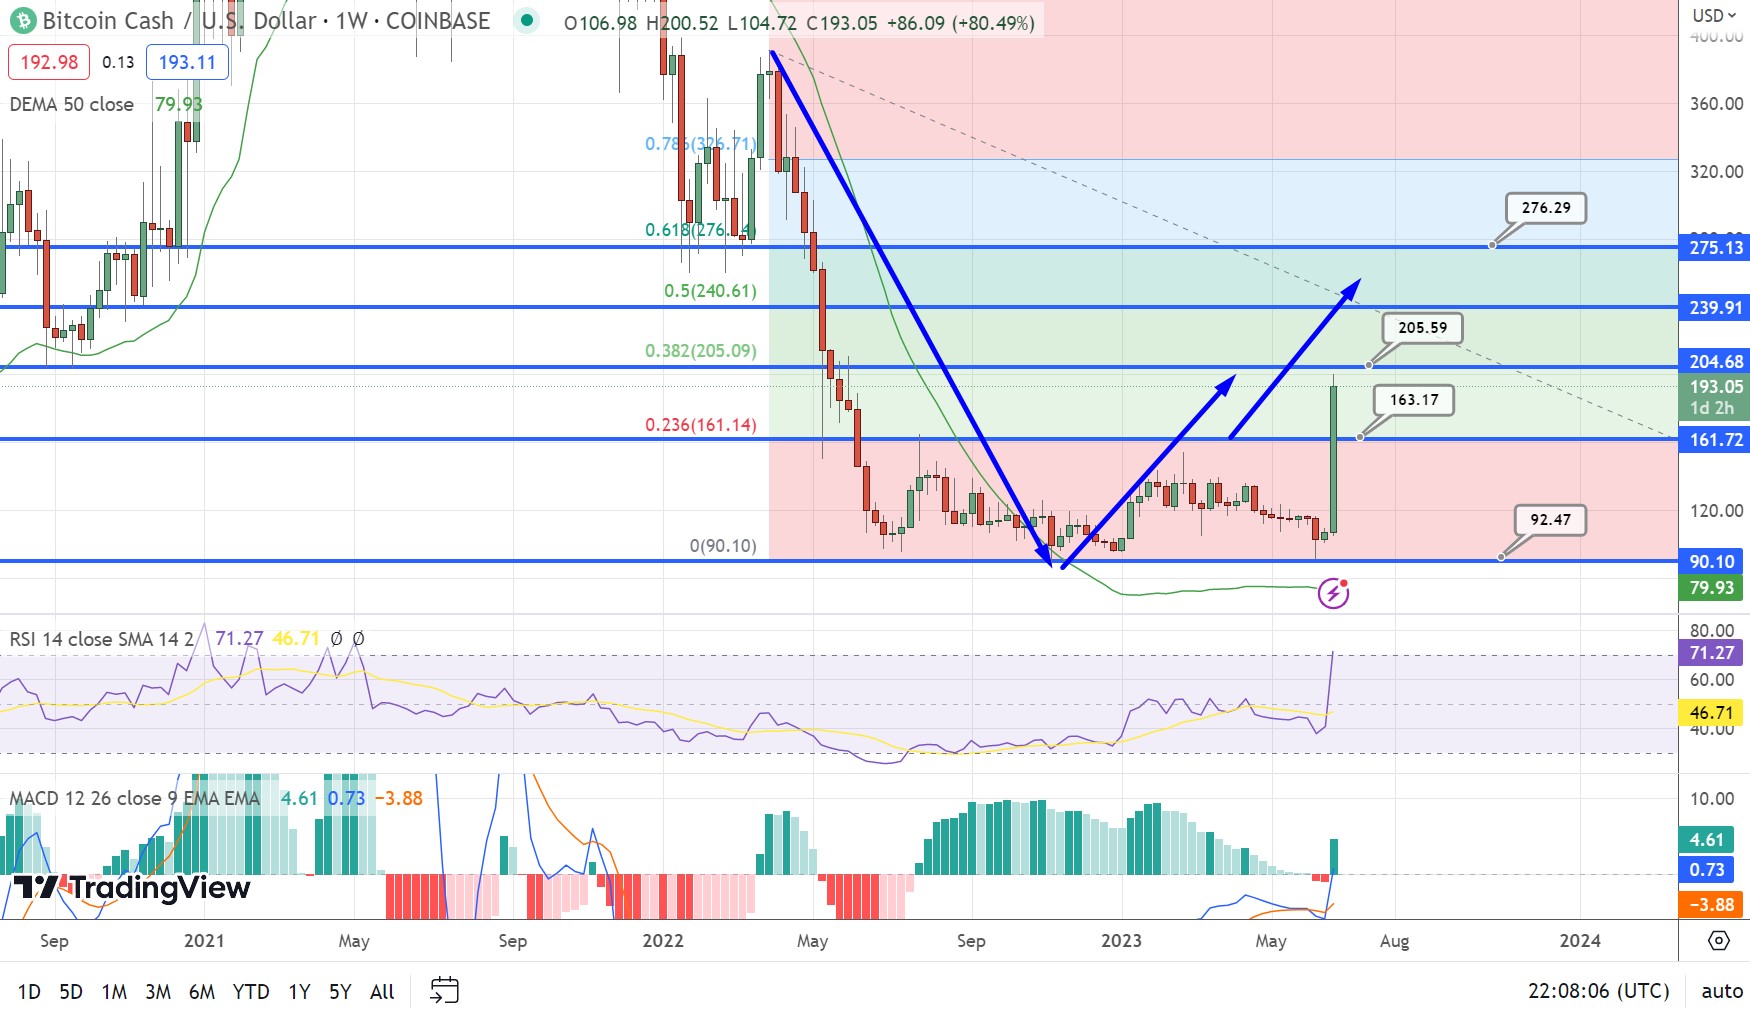 Bitcoin Cash price chart – Source: Tradingview
This presents an opportunity for sellers looking to capitalize on a potential correction below $150, with target support levels at $130 and $120.
If the price falls below $120, more selling opportunities could arise with targets at $111 or even $100.
On the other hand, a decisive break above $150 could fuel Bitcoin Cash’s ascent to new highs of $161 or $172.
Traders and investors should keep a close eye on price action around that crucial $150 level as it has a significant impact on Bitcoin Cash’s near-term direction.
It is important to note that Bitcoin Cash currently shows no signs of hitting $1,000 in 2023.
Therefore, it becomes even more important to focus on the immediate price levels and key support/resistance areas.
Traders are advised to stay abreast of the latest market developments and use proper risk management strategies to make informed decisions.
Learn Crypto Trading, Yield Farms, Income strategies and more at CrytoAnswers
https://nov.link/cryptoanswers
Comments are closed.