


Vladislav Sopov
Here’s what the Stochastic RSI (STOCH RSI), one of the most reliable indicators in technical analysis, is telling us about the BTC price outlook
contents
- Stochastic RSI: BTC remains oversold for all of 2022
- Fear and Greed Index falls to 20 as BTC falls below $19,000
The Stochastic Relative Strength Index (Stoch RSI), a key momentum indicator, says that if history repeats itself, Bitcoin (BTC) may be nowhere near its price bottom.
Stochastic RSI: BTC remains oversold for all of 2022
As of mid-October 2022, the Stochastic RSI for Bitcoin (BTC) price remains in the “oversold” territory. The Stoch RSI is below 20/100 for ten straight months – since January 2022.
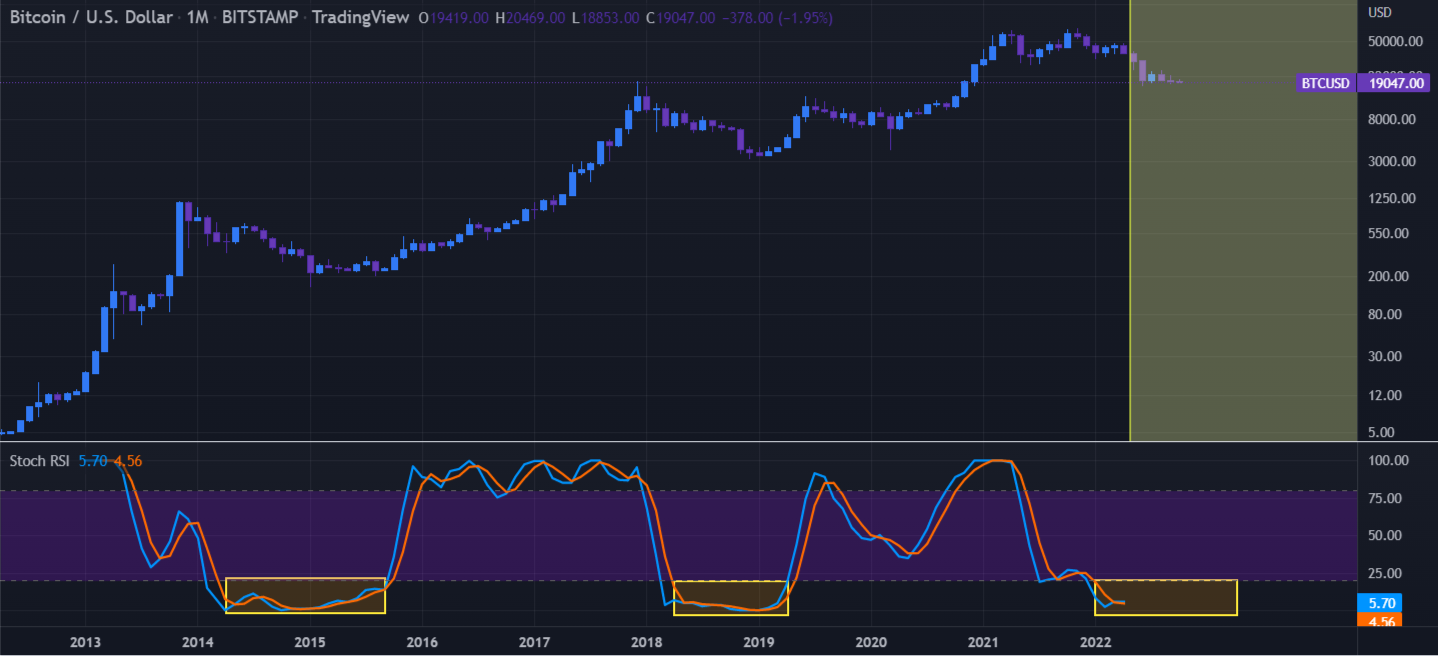 Image via TradingView
The longest “oversold” periods to date have been April 2014-September 2015 and April 2018-April 2019. This means that the bearish recession for the first cryptocurrency is far from over.
However, periods of “oversold” Stoch RSI present amazing buying opportunities for long-term investors.
To sue
The Stochastic Relative Strength Index or Stoch RSI is calculated by applying the Stochastic Oscillator formula to a series of Relative Strength Index (RSI) values registered over this or that time period.
Fear and Greed Index falls to 20 as BTC falls below $19,000
Just like the “regular” RSI, this indicator is used to check whether the market is controlled by bulls or bears. Stoch RSI above 80/100 means the asset is overbought; When the indicator falls below 20/100, traders say it is oversold.
Meanwhile, yesterday Bitcoin (BTC) briefly fell below $19,000 for the first time in a week. Following that drop, Alternative’s Fear and Greed Index also plummeted to 20, its lowest level since mid-July.
The indicator has not been able to leave the “Extreme Fear Zone” for more than two months in a row.
Learn Crypto Trading, Yield Farms, Income strategies and more at CrytoAnswers
https://nov.link/cryptoanswers
Comments are closed.