


Bitcoin (BTC) price chart shows efforts to surpass $30,000, which is a strong hurdle that buyers have faced over the past session. BTC price is trading below with low volume suggesting low interest in the last session. The price action suggests that BTC is trading near the 50-day EMA and buyers are facing pressure from the bears, who have been instrumental in preventing it from reaching this range.
The chart shows that BTC has been in an uptrend for the past few months, climbing the levels significantly. Furthermore, the lower trend line was also respected and rallied multiple times as shown in the charts. However, the formation of a head and shoulders pattern also indicates bearish sentiment for the coming sessions if the price breaks below the trendline below the 200-day EMA.
However, BTC price has only declined slightly from the top. It is consolidating near $30,000 suggesting buyers are poised to retest the highs and make an effort, but failed due to aggressive sellers who had a firm grip on the price, preventing the span has been exceeded. Buyers persisted in holding gains near $29,000 but faced selling pressure that led to a gradual decline and lower lows in recent sessions.
At press time, Bitcoin (BTC) is priced at $29,060.57, with a 0.58% intraday drop showing neutral signs. Additionally, trading volume increased by 1.90% to $9.26 billion. However, the market cap of BTC is $564.68 billion. BTC intraday high is $29,274.83 and intraday low is $28,945.88, showing selling pressure from above.
BTC price action on daily charts
Source: BTC price chart at TradingView
On the daily charts, BTC price stayed near the 50-day EMA and traded below $30,000 just under $29,800. Additionally, price action suggests that sellers have gained momentum while buyers are losing strength.
According to Fib readings, BTC price is over 50% trying to surpass 61.8% at $29,600 and has been rejected in past sessions. However, the price is near the lower Bollinger Band and the band is shrinking, suggesting that a crucial move is imminent.
What do technical indicators say?
 Source: BTC price chart at TradingView
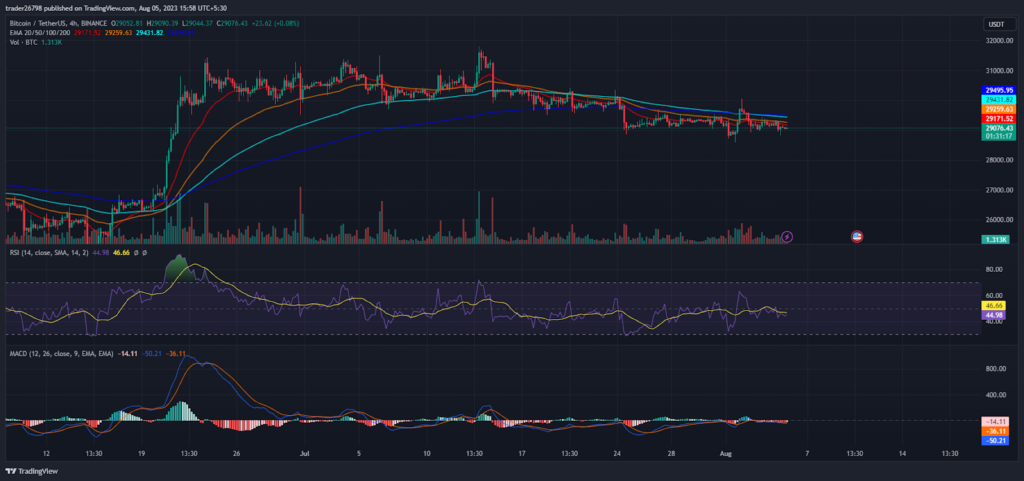
On the 4-hour chart, BTC price has stayed in a tight range and has been consolidating over the past few sessions. In addition, the chart shows sequences of lower lows that retrace from the highs and rally to find crucial support where there was a bounce.
The RSI curve remained near 52 and showed neutrality on the charts, indicating less investor interest.
Similarly, the MACD indicator showed the convergence of the moving averages and indicated neutrality, suggesting upcoming volatile moves.
Diploma
Bitcoin (BTC) price is showing consolidation and has remained in a tight range below the $30,000 hurdle for the past few sessions. Furthermore, the price action in favor of the sellers suggests that the price is moving towards the 200-day EMA to find strong support.
Technical levels:
Support Tiers: $28,600 and $28,000
Resistance levels: $30,350 and $31,000
Disclaimer
The views and opinions expressed by the author or persons named in this article are for informational purposes only and do not constitute financial, investment or other advice. Investing in or trading in crypto assets involves risk of financial loss.
 Latest posts by Ritika Sharma (See everything)
Learn Crypto Trading, Yield Farms, Income strategies and more at CrytoAnswers
https://nov.link/cryptoanswers
Comments are closed.