


According to CoinMarketCap rankings, Monday started on an upbeat note for the cryptocurrency market.
BTC/USD
Bitcoin (BTC) price is up 4.55% since yesterday.
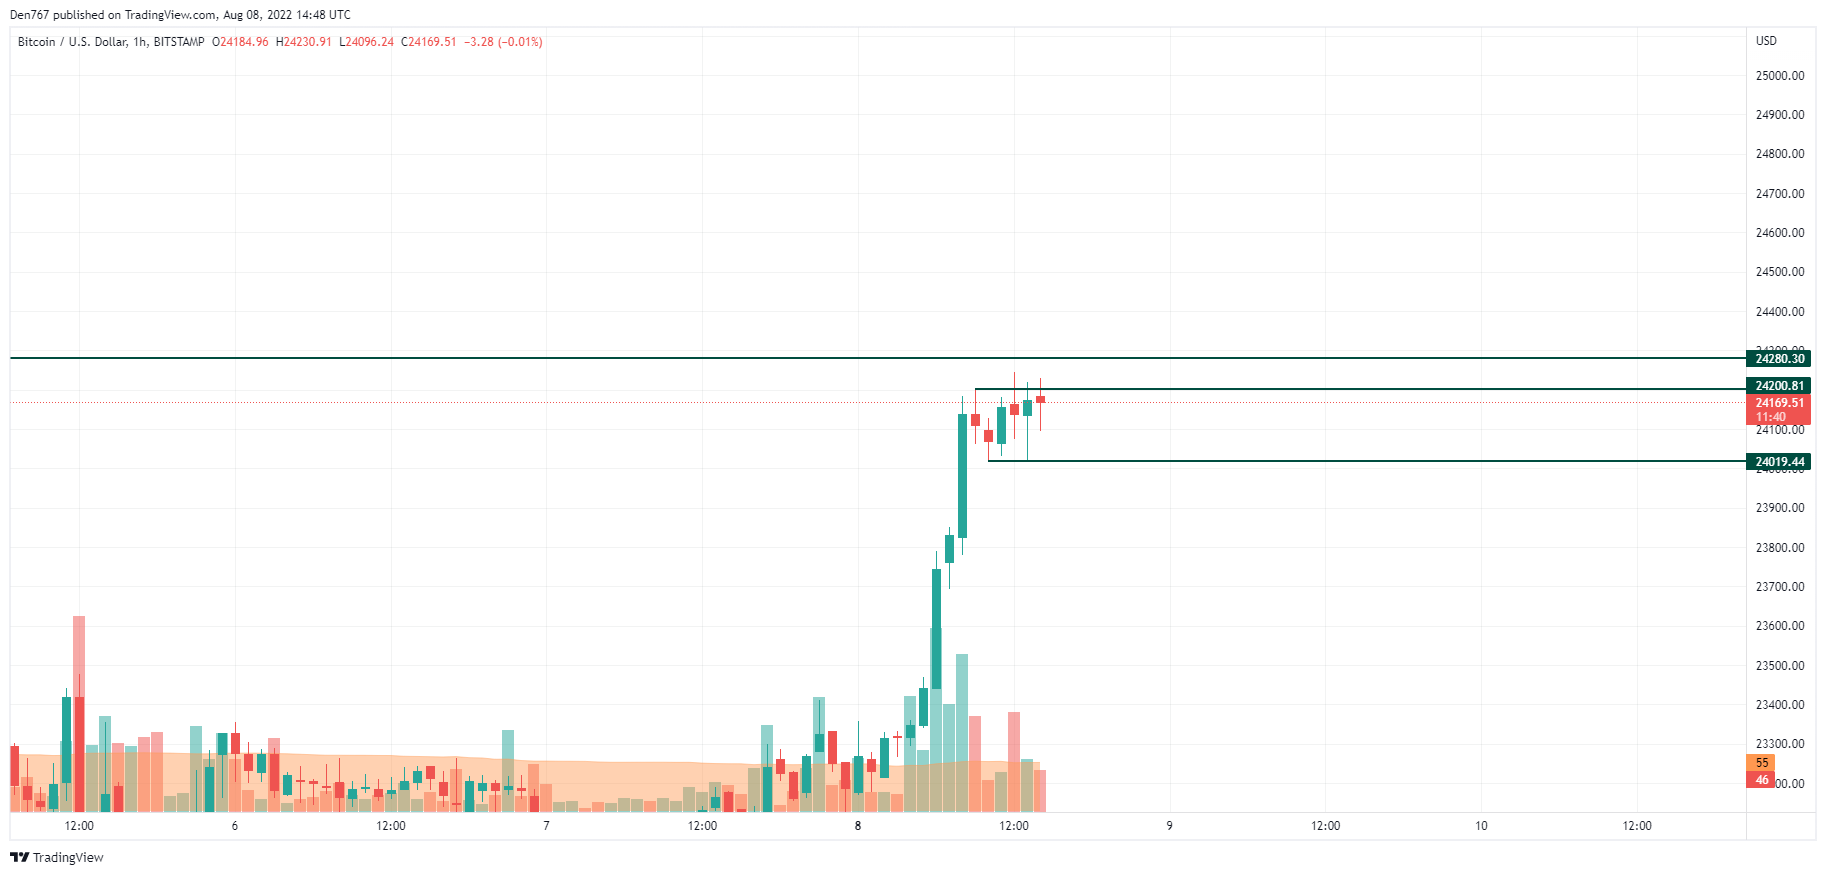
On the local chart, Bitcoin (BTC) is approaching the recently formed resistance level at $24,200. If there is a breakout, the price can reach the $24,500 zone by the end of the day.
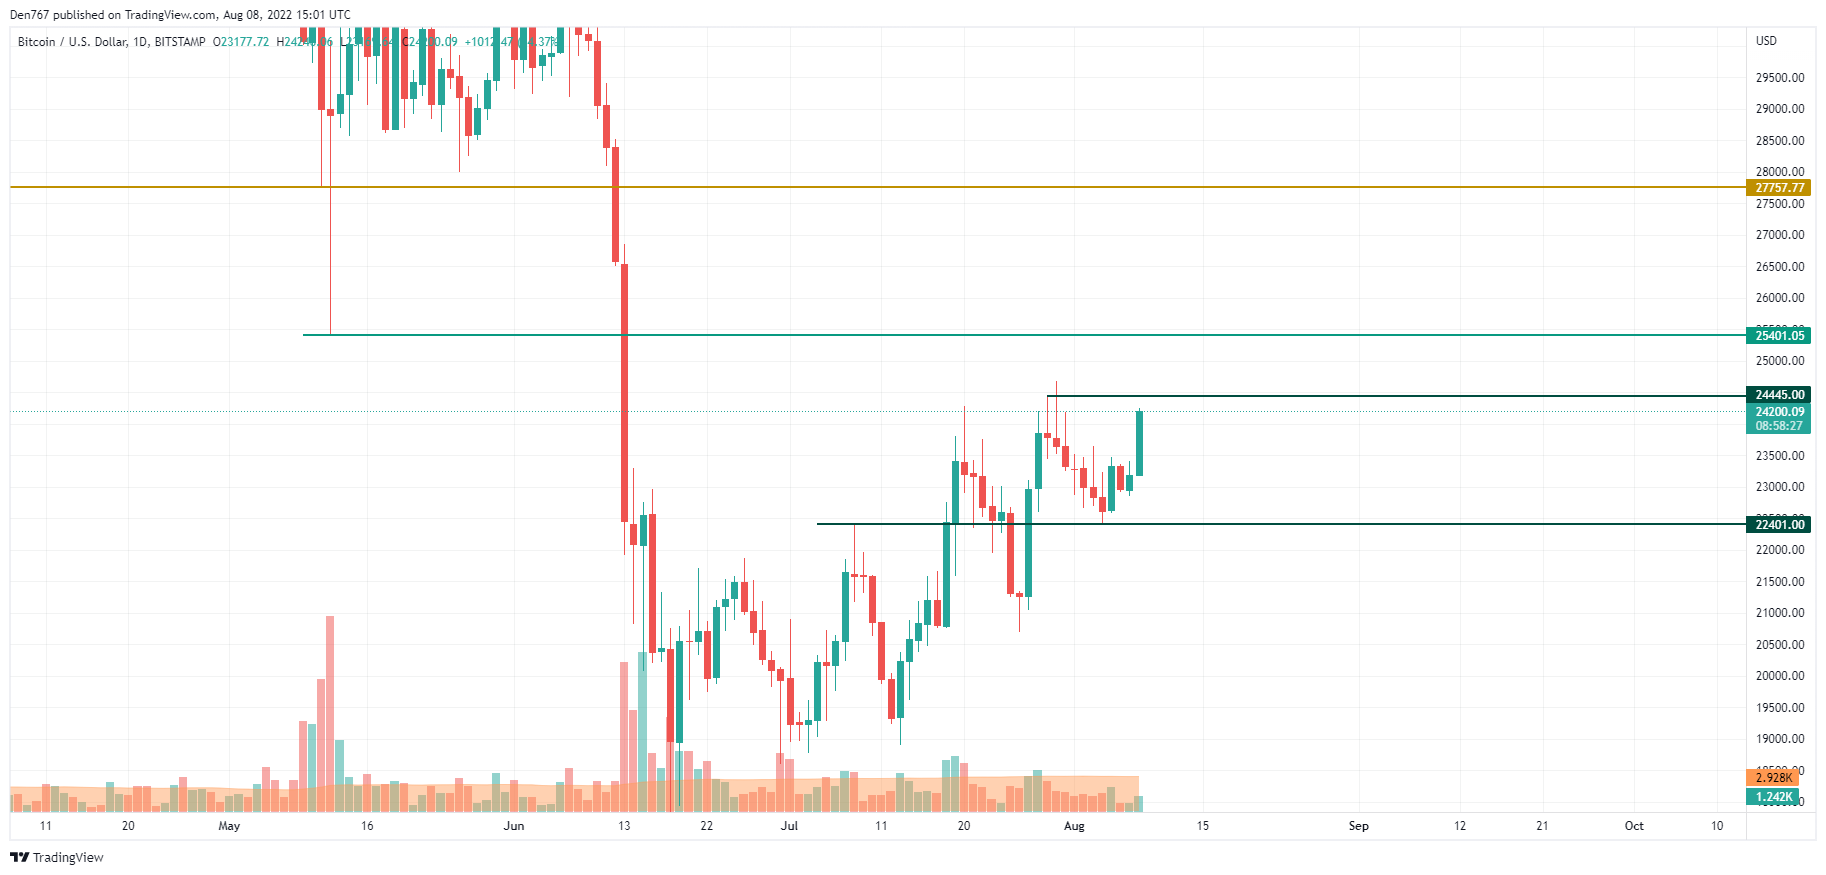
On the larger timeframe, Bitcoin (BTC) broke through $24,000, which means the bulls are poised for another surge. If the daily candle closes near $24,445, it could lead to growth into the $25,000 area by mid-August.
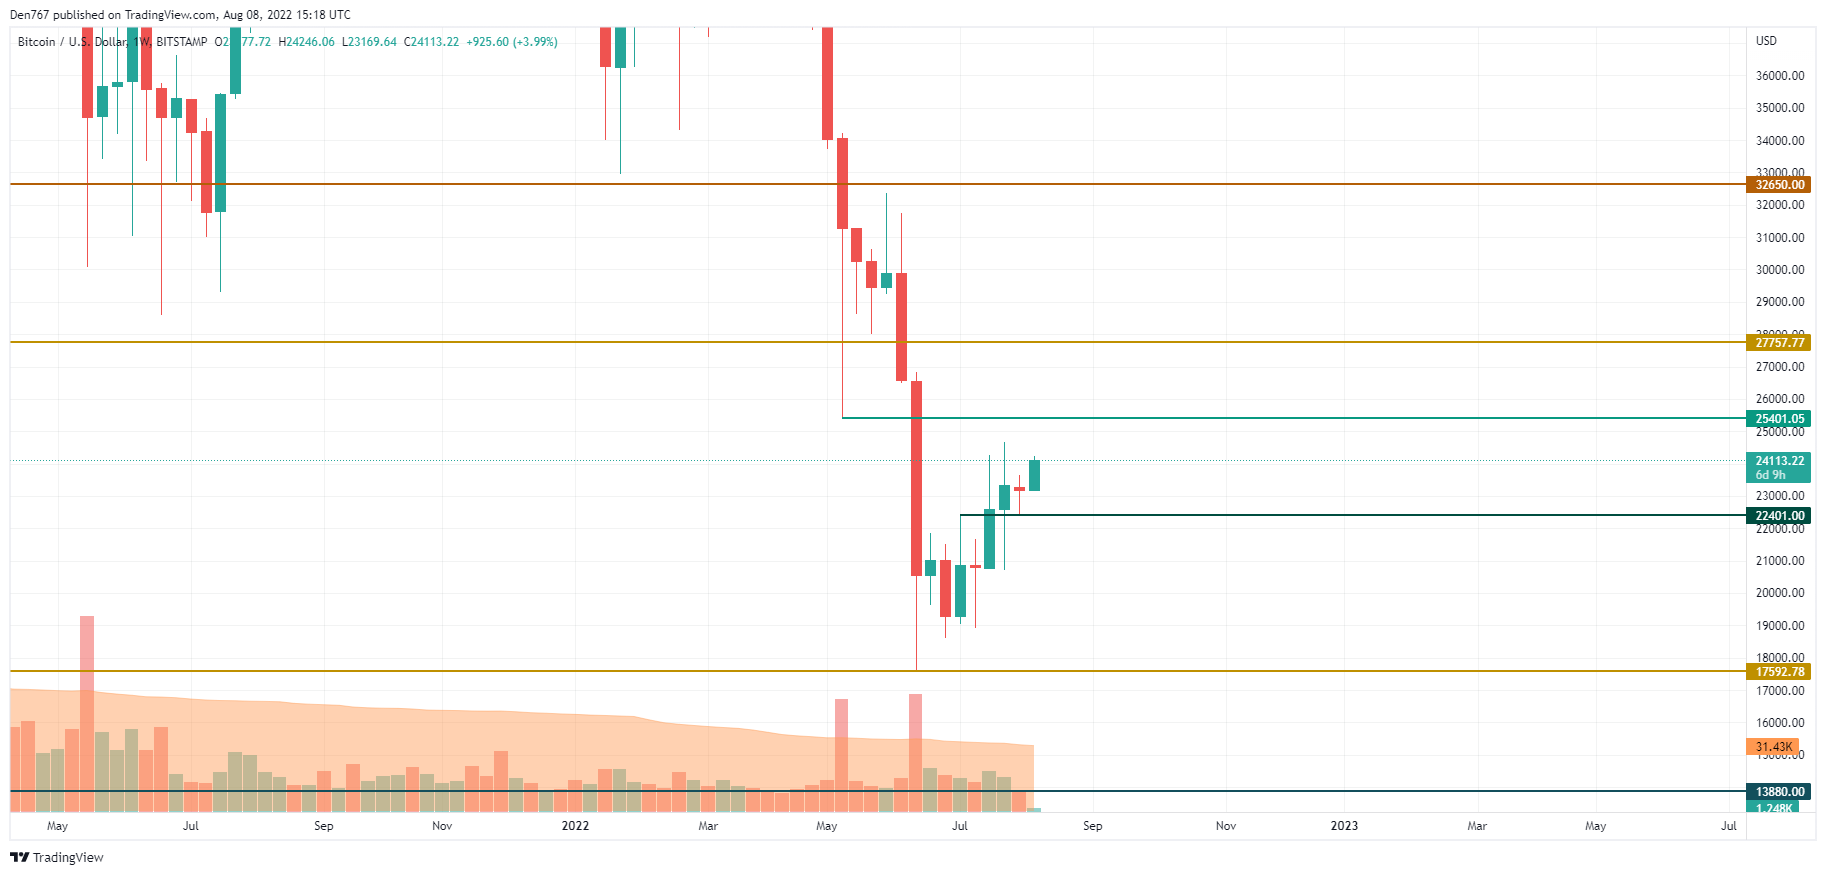
On the weekly chart, the bulls have continued their upward move. If they can sustain the price of Bitcoin (BTC) above $24,000 by the end of the week, chances are a test of the $25,400 mirror level will be seen in the next few days.
Bitcoin is trading at $24,111 at press time.
Learn Crypto Trading, Yield Farms, Income strategies and more at CrytoAnswers
https://nov.link/cryptoanswers
Comments are closed.