


Bitcoin (BTC) price peaked at $53,015 on February 20 but has since corrected.
Bitcoin is trading at the top of a short-term correction pattern. Can it break out or has the price reached a local high?
Bitcoin is showing weakness
Technical analysis on the daily time frame shows that BTC price has been increasing since January 23rd. It rose 40% in 28 days, reaching a high of $53,015 on February 20th. This was the highest Bitcoin price since 2021.
While BTC price has declined slightly as it is still trading above $51,000. However, due to the rapid increase, there is no horizontal support below the current price.
BTC/USD six-hour chart. Source: TradingView
While the price action is positive, the daily Relative Strength Index (RSI) is providing bearish signs. Market traders use the RSI as a momentum indicator to identify overbought or oversold conditions and decide whether to accumulate or sell an asset.
Read more: Where to trade Bitcoin futures
Readings above 50 and an uptrend suggest bulls still have the advantage, while readings below 50 suggest the opposite. The daily RSI created a bearish divergence (green) and fell below 70 (red symbol) this week.
What do analysts say?
Cryptocurrency traders and analysts on X are positive about the future BTC trend.
CryptoMichNL expects BTC price to peak at nearly $58,000 before the halving and a significant correction to follow thereafter.
“I don’t know if we will get this correction in #Bitcoin in the short term. “I think this rally will peak between $54,000 and $58,000 and trigger a significant correction to $40,000 and $42,000 after the halving,” he explained.
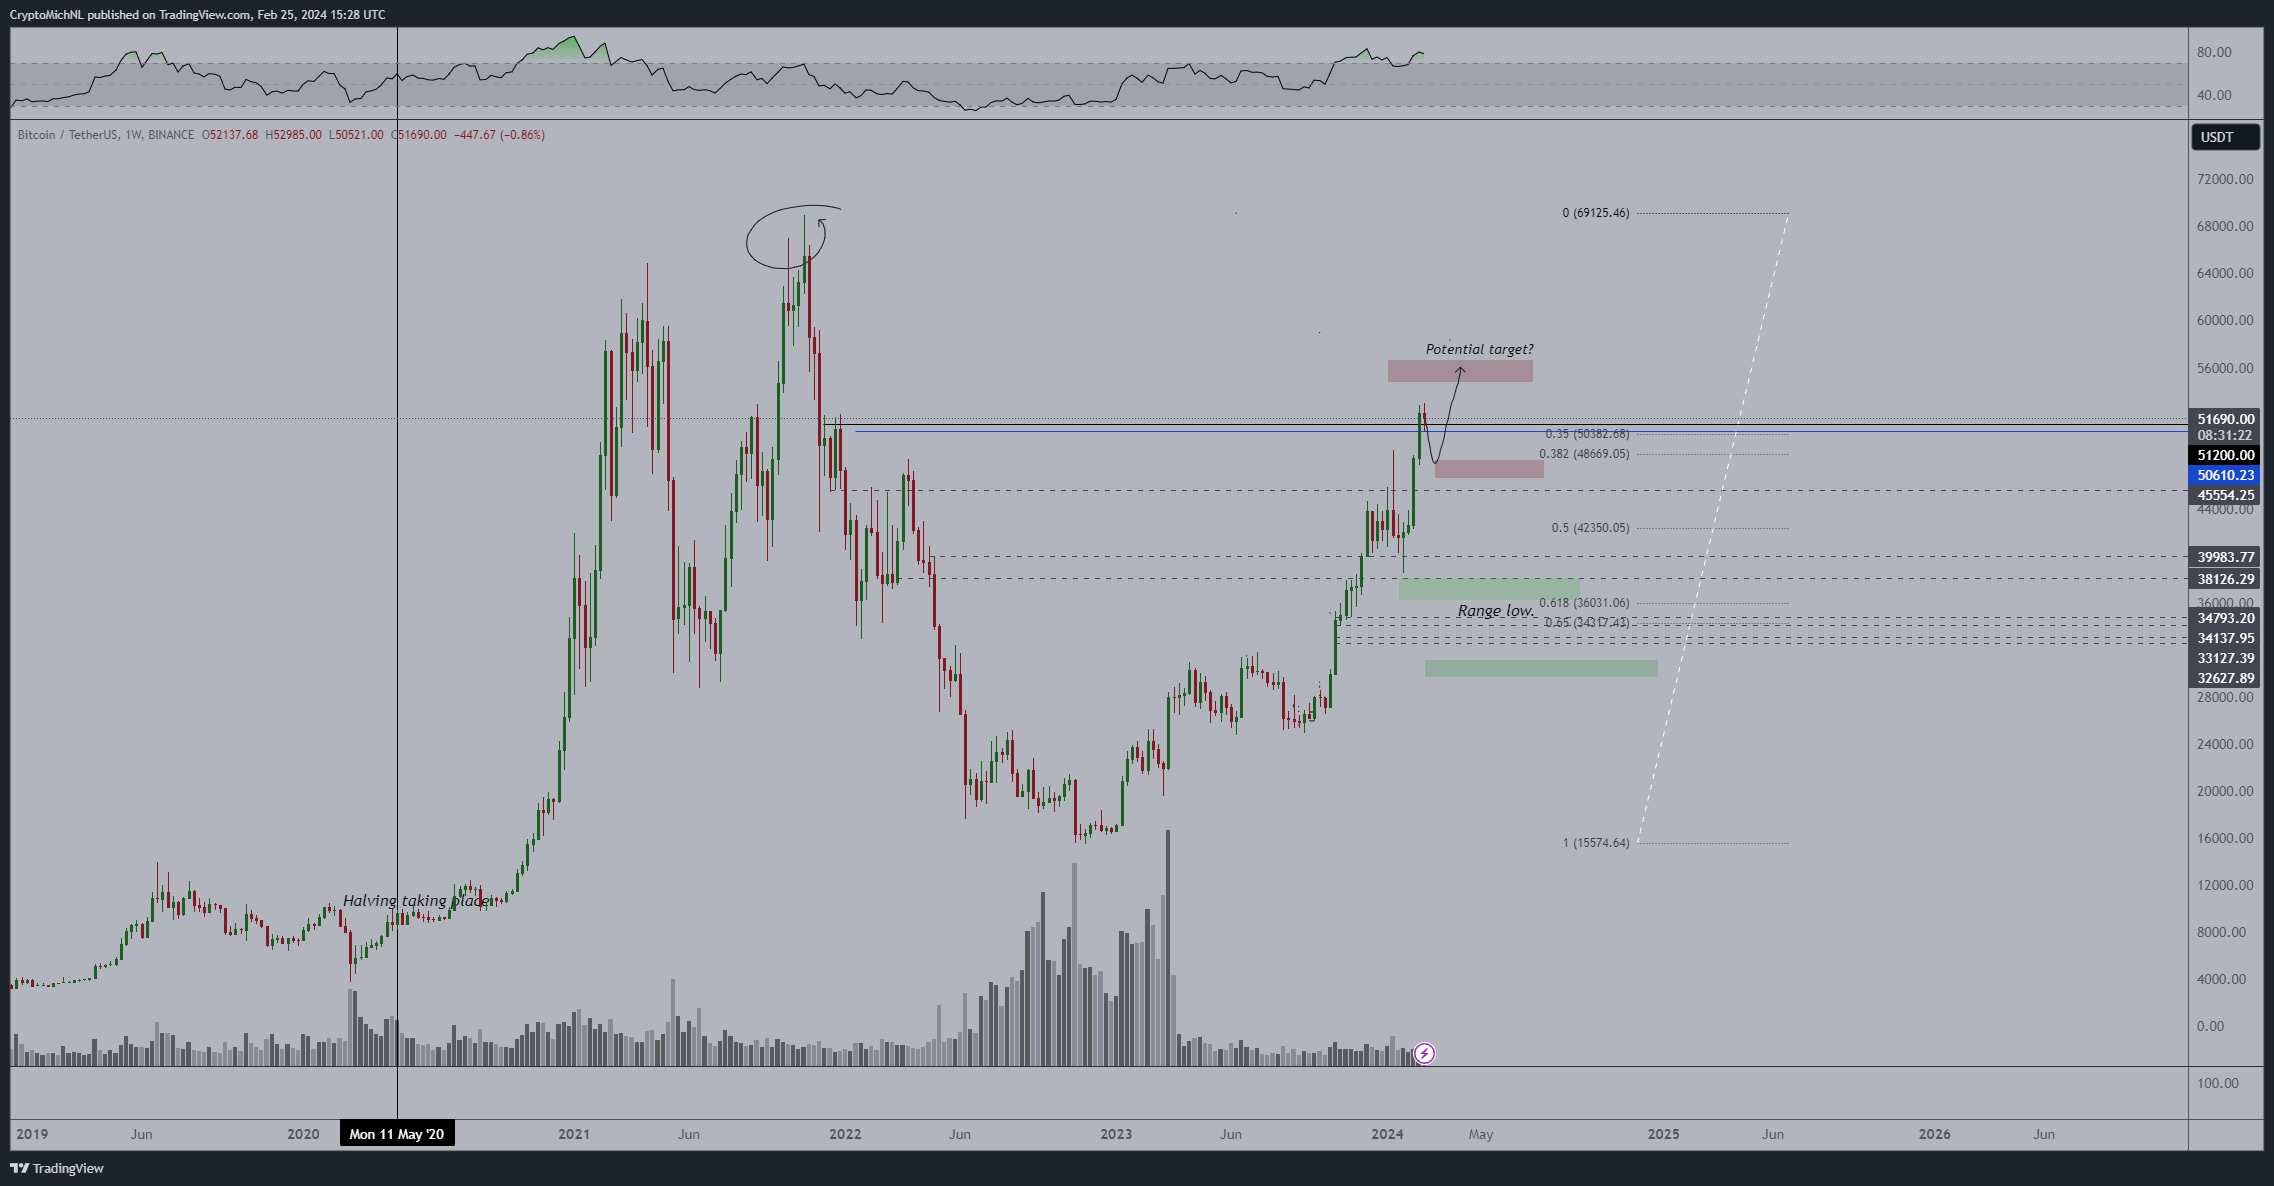 BTC/USDT weekly chart. Source: X
Mesawine1 suggests that BTC price is completing a short-term correction, after which a significant upward move will take place. Although the wave is bullish, he believes BTC will underperform altcoins in the short and medium term.
Read more: Who will own the most Bitcoins in 2024?
BTC price prediction: Is the trend still bullish?
The shorter six-hour time frame provides more bullish reading than the daily. This is due to the positive price development. Since the February high, the price of Bitcoin has fallen within a descending parallel channel. These channels usually contain corrective movements. Therefore, a breakout from this will be the most likely scenario.
Furthermore, BTC price moved in a range between $51,300 and $52,400 during this period. Each time it broke below the low of the range (green symbols), it bounced off the channel's support trendline and reclaimed the range. BTC is currently trading in the upper part of the channel. If BTC breaks out, it can rise by 6% to the next resistance at $54,300.
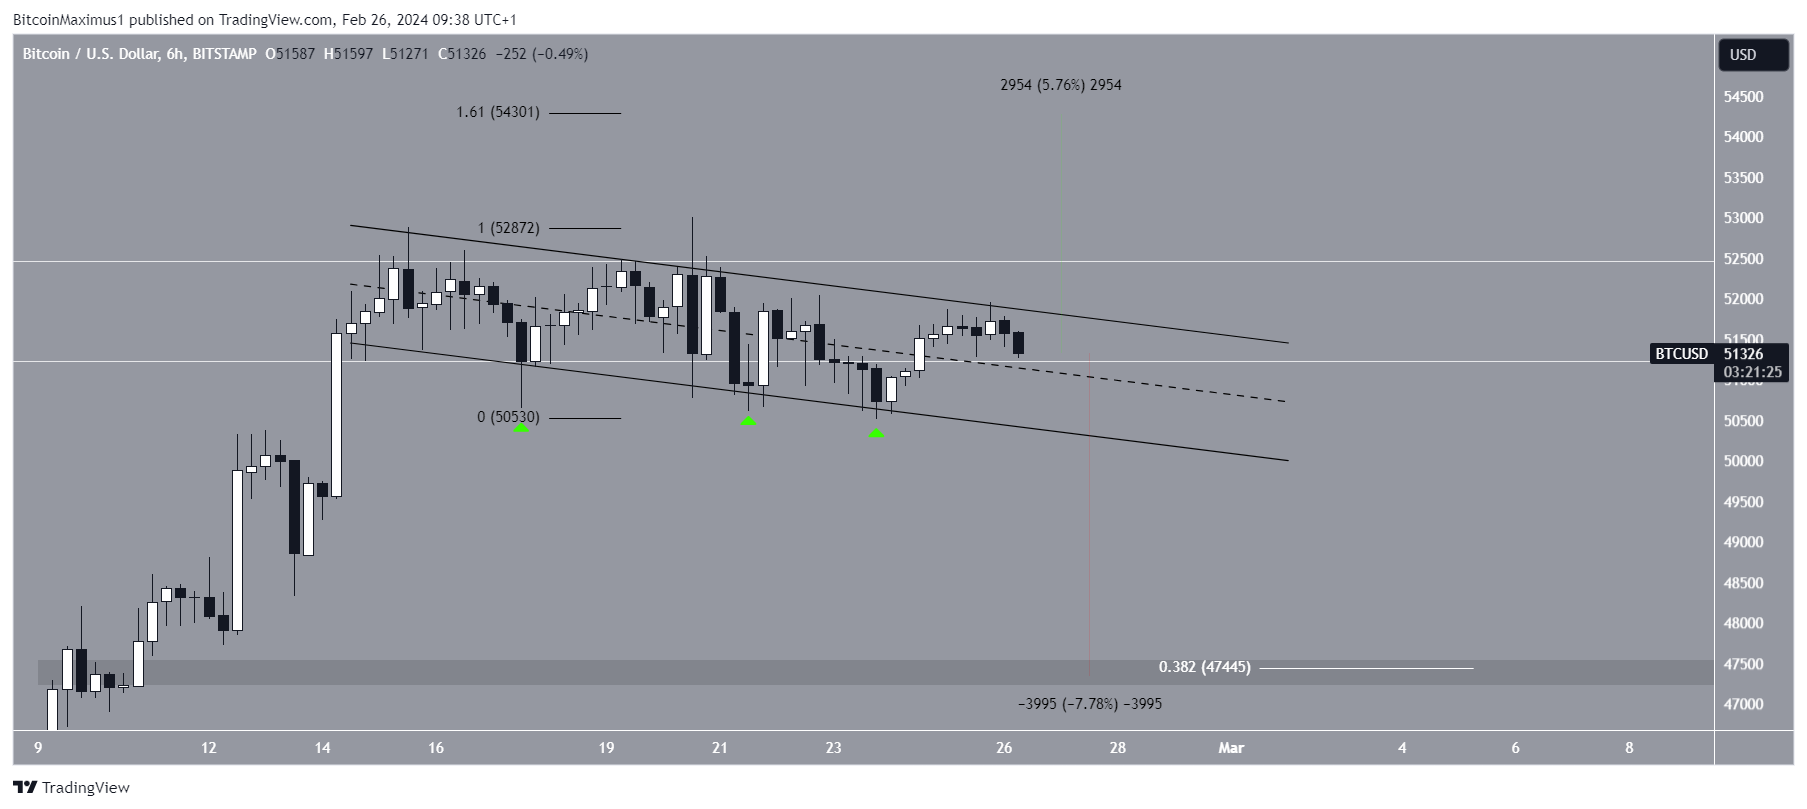 BTC/USDT six-hour chart. Source: TradingView
Despite this bullish BTC price prediction, a break above the channel could result in an 8% decline to the horizontal and Fib support at $47,400.
Read more: What is a Bitcoin ETF?
For BeInCrypto'Click here to read the latest cryptocurrency market analysis.
Disclaimer
In accordance with Trust Project policies, this pricing analysis article is for informational purposes only and should not be considered financial or investment advice. BeInCrypto is committed to accurate, unbiased reporting, but market conditions are subject to change without notice. Always do your own research and consult a professional before making any financial decisions. Please note that our Terms and Conditions, Privacy Policy and Disclaimers have been updated.
Learn Crypto Trading, Yield Farms, Income strategies and more at CrytoAnswers
https://nov.link/cryptoanswers
Comments are closed.