


Bitcoin is undoubtedly the crown jewel of cryptocurrencies. The success of this crypto is imperative for the survival of the entire industry. Viewing BTC as a safe haven has allowed others to focus on mass cryptocurrency adoption. BTC is valued at $781,694,938,483 with 91% circulating of its total supply.
At the current price of $42,291, Bitcoin is neutral compared to the previous 90-day price level. Despite the ups and downs, Bitcoin is nowhere near where it was during the 2021 earnings-booking session. Buying sentiment would revive if BTC clears the immediate and strong resistance levels.
Bitcoin turned positive for March after being supported by a strong breakout that started a strong bullish move. With the renewed assault on the all-important 200-day moving average, investors are confused about future BTC opportunities.
A retracement from these levels can push bitcoin below $40,000. Click here for a deeper dive into the minute intricacies of BTC price action across various technical indicators.
Bitcoin has turned negative on daily charts, with a clear loss over the past 13 trading sessions. While this drop is negative, it is by no means weak. For the past few days, BTC price has been trying to avoid a fresh breach of $45,000 and stay in a consolidation zone for more price action.
This claim is backed up by the RSI curve, the price trend pushed the RSI below 45. This sharp drop in buying sentiment creates a potential for the price to match sentiment or vice versa.
Transaction volume has stayed the same over the past two months, so the shift towards other cryptocurrencies doesn’t seem to explain this decline. Prior investors would be looking for a consolidation near the 200-DMA curve to buy.
Once BTC manages to clear the resistance and profit-booking sentiment near its 200-DMA curve, we can expect a better rally towards $50,000 and above. $45,000 comes out as immediate resistance ahead of the $48,000 200-DMA curve.
Breaking these two levels will put the buyers in front of another massive resistance level of $52,800, which ordered the price action for Bitcoin for four months. The scope has increased and BTC can range between 10% and 25% in the coming months.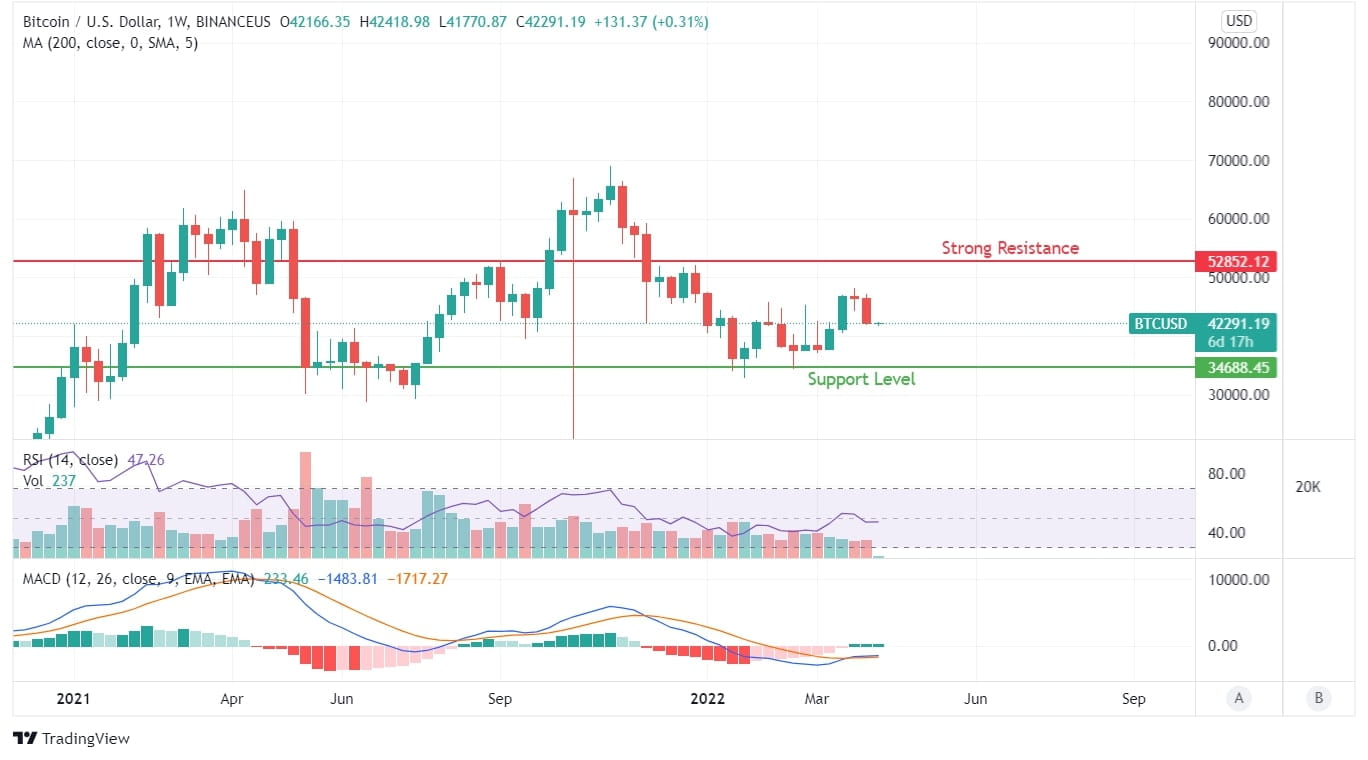
On the weekly chart, the candlesticks tell a different story. The first candlesticks of March 2022 indicated mixed sentiment, with the bottom level fixed at around $36,500. On the back of these candlestick patterns, BTC marked a breakout in an attempt to break through another significant level of resistance.
After two weeks of bullish buying, the formation of a pin bar candlestick held buyers at higher levels. Fresh sentiment may resurface after breaking $48,300 or pull back a few thousand points below, offering BTC buyers better value to average their past investments. The MACD line on weekly charts is forming a bullish crossover and remains positive, while the RSI remains in neutral territory.
Learn Crypto Trading, Yield Farms, Income strategies and more at CrytoAnswers
https://nov.link/cryptoanswers
Comments are closed.