
Bitcoin (BTC), Ethereum (ETH) Weekly Forecast: Possible short-term jump into the future


IMPORTANT POINTS:
Recommended by Zain Vawda
Get your Free Bitcoin Prediction
Most read: Bitcoin Technical Outlook: Down, but not out
FTX FALLOUT CONTINUES TO AFFECT CRYPTO MARKETS
The crypto market as a whole continues to face significant headwinds as the fallout from FTX continues to unfold. Crypto exchanges are struggling to convince customers that their assets are safe, as data was recently released by CryptoQuant showing that Bitcoin, Ethereum and stablecoin reserves have plummeted since the FTX scandal. Exchange platforms from Binance to Crypto.com have struggled by fully or partially disclosing their assets while users continue to withdraw funds.
The biggest spread impact so far has been experienced by Gemini Trust Co., which announced a suspension of redemptions in its lending unit, while Blockfi Inc. is on the verge of filing for bankruptcy. Genesis has warned investors of a possible bankruptcy filing if it is unable to raise $1 billion in fresh capital to support its lending unit.
Recommended by Zain Vawda
Get your free introduction to cryptocurrency trading
These developments have kept the Crypto markets on the back foot struggling to make meaningful gains. In a week when risk sentiment for equities improved and the US dollar fell after dovish FOMC minutes, both Bitcoin and Ethereum failed to benefit as trading volumes also continued to decline. However, both BTC/USD and ETH/USD remain on course for minor gains this week into the weekend.
ETH/USD TECHNICAL OUTLOOK
ETH/USD weekly chart

Source: TradingView created by Zain Vawda
From a technical perspective, Ethereum (ETH/USD) is trading inside a bearish pennant pattern on the weekly timeframe, which is suggesting a breakout to the downside. Opportunity remains for a boost to the upside to retest the descending trendline before a downside breakout occurs. However, the 200-day ma is just above the current price around the $1338 area, which could halt any attempt upside. A downside breakout of the pennant pattern could result in a retest of the June 13 YTD low that is hovering around the $864 area.
BTC/USD TECHNICAL OUTLOOK
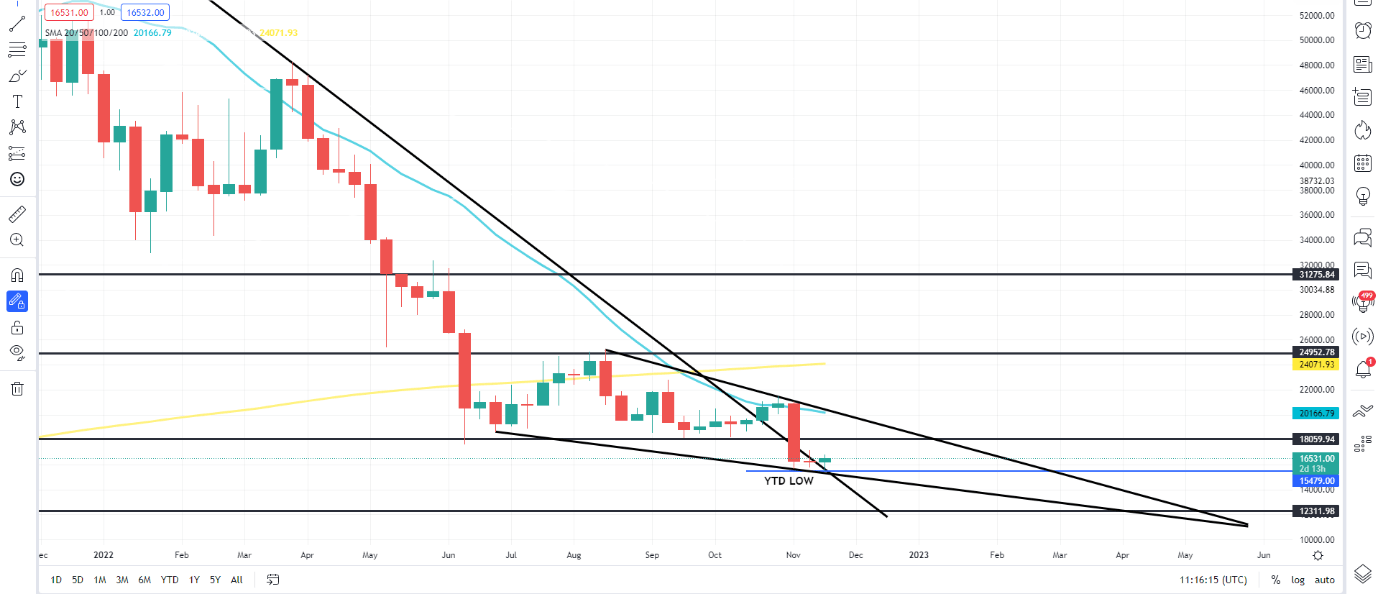
BTC/USD weekly chart
Source: TradingView created by Zain Vawda
From a technical perspective, BTC/USD has retested the November 2021 long trend line and is trading just above it. The pair has already seen a false breakout above this trendline in the last week of October before falling back below the trendline. This week, the pair posted a fresh YTD low around the $15,479 area, bouncing off the bottom of a falling wedge pattern. The falling wedge pattern coupled with a break of the long-term (2021) descending trendline suggests a potential bullish move into the new week. A move to the upside faces significant hurdles as the $18,000 level (September and October lows) is expected to provide resistance, while a break to the upside must clear the 20-day MA before a break of the falling wedge pattern comes into play. The breaking of the falling wedge pattern, should it happen, could take a few weeks to play out and perhaps something to watch for.
Introduction to Technical Analysis
Technical analysis chart pattern
Recommended by Zain Vawda
Alternatively, a break below the falling wedge pattern would need to clear the psychological $15,000 level first, which could open a test of the October 2020 resistance turned into support area around $12,300.
BTC/USD daily chart

Source: TradingView created by Zain Vawda
After a bullish engulfing candle close on Tuesday, BTC/USD followed with another bullish day before closing as a doji candle on Thursday. The close of the doji candle once again underscores the downward pressure on the crypto markets as it came a day after dovish FOMC minutes in which the US Dollar Index fell.
A daily candle close above the $16,800 level would be the first sign of a bullish shift in price action as that would be a higher high for the pair and BTC/USD could potentially race into the $18,000 resistance area. The 20-day ma provides near-term resistance currently resting around the $17,000 area which could cause the rally to stall and give the pair an opportunity to form a new lower high before its next move higher .
— Written by Zain Vawda for DailyFX.com
Contact and follow Zain on Twitter: @zvawda
element within element. This is probably not what you wanted to do! Instead, load your application’s JavaScript bundle into the element.
Learn Crypto Trading, Yield Farms, Income strategies and more at CrytoAnswers
https://nov.link/cryptoanswers
Comments are closed.