


D-None/iStock via Getty Images
thesis
In my last article on Bitcoin (BTC-USD), I gave Bitcoin a bullish rating as the coin chart was still showing an Elliott wave and was trading in a bullish channel. With uncertainty in the markets Amid inflation and Fed rate hikes, broader markets have been punished. However, bitcoin prices collapsed and broke critical support levels that had to be held to validate the Elliott Wave and bullish sentiment on the cryptocurrency.
Elliott Wave has been invalidated
In my comments to my last article, there was some debate as to whether or not an Elliott Wave was even in shape. I would like to say that in terms of guidelines and observations, Elliott waves are not always perfect. The first issue raised in my comments concerned the fact that wave three cannot be the shortest wave. That’s right, and wave three was shorter than wave one. However, wave five may be the longest wave, and trying to predict movement based on wave structure doesn’t invalidate a theory because it hasn’t happened yet. It’s obviously easy to identify Elliott Waves when they’ve already occurred. In the case of Bitcoin, a fifth wave larger than wave three would have validated an Elliott wave. The other concerns looked at the guideline stating that wave four pullback cannot penetrate wave one territory. This is correct in the most basic Elliott Waves. However, if diagonals are observed, especially leading diagonals, wave four can actually enter the territory of wave one without invalidating an Elliott wave. The Bitcoin candle chart showed the smallest leading diagonal. It’s quite difficult to identify as the trend lines are almost perfectly parallel.
Having addressed concerns in my previous article, I will point out a basic Elliott Wave guideline that cannot be justified with nuance or observation. That is, wave five cannot break below the low created in wave four. With the devastation in the markets today, exactly what has happened has wiped out the potential for an Elliott wave on the Bitcoin candlestick chart.

Elliott Wave Invalidated (made by the author) (tradingview.com)
The chart above shows that the critical support level of around $33,000 has clearly been broken. This invalidates the potential for an Elliott wave. I also placed trendlines from waves one and three, and two and four to demonstrate the leading diagonal that kept the potential for an Elliott wave valid as wave four entered wave one’s price area. Anyway, it doesn’t matter now that the low created in wave four has officially been broken. Considering inflation, Fed rate hikes, the performance of the Dow and the S&P, this is a particularly bearish price action for Bitcoin.
Additional bitcoin support levels to monitor going forward
Below is a chart of different support levels to monitor going forward. Inevitably, I believe the break of the $33,000 support is a significant bearish move, especially considering broader market conditions.
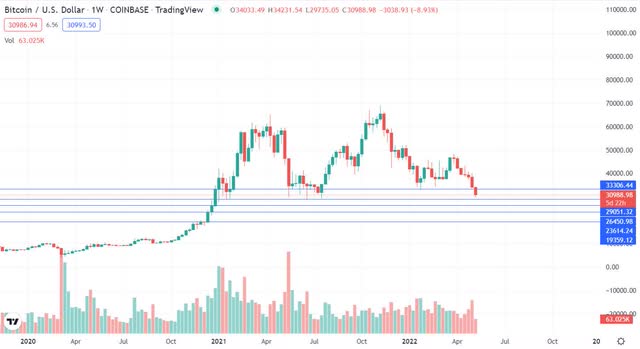
Additional bitcoin support levels (created by the author) (tradingview.com)
I can’t tell how far bitcoin will fall, but the following support levels are not entirely favorable for those that hold for long. Bitcoin has managed to avoid breaking the $29,000 support level for now. If it surpasses $29,000, the following support levels are $26.4, $23.6, and $19.3,000. I’m not going to say that bitcoin is completely down; it could scale above $33,000 and continue to consolidate. However, things are looking good for now. At the current rate, Bitcoin appears to be headed for a price channel of around $23,000-$26,000.
Some positive aspects to consider
All my posts on cryptocurrency have been positive as I believe there is application potential in many crypto projects. Still, after the bloodbath in today’s market, I think there are some positives to consider. First, by their very nature, crypto markets are extremely volatile. Those experienced in the crypto market know that significant price movements can occur on a whim. Whether it’s general market issues, liquidations, news out of China, or almost nothing that happened today is nothing out of the ordinary. The crypto market has seen this before and caught on. The second is that Bitcoin has been consolidating at prices above $30,000 for quite some time. Prices didn’t skyrocket, but remained stable. Considering the observed economic conditions, Bitcoin’s price action is not unjustified. My point is that Bitcoin’s price action is not behaving irrationally compared to the broader market. I find this to be a positive feature of the pullback seen in Bitcoin’s price. The third is Bitcoin’s fear and greed index. Bitcoin’s rating is in the extreme fear zone with a score of 10. The scale ranges from 1 to 100, with 1 being the most fearful and 100 being the most greedy. The Greed and Fear Index is fairly accurate in determining if a security has become oversold into “extreme fear” areas. Considering that Bitcoin is already in “extreme fear” territory and just 9 points off the bottom, it is likely that the bleeding will subside sooner or later. Additionally, Bitcoin’s Stochastic Relative Strength Index (RSI) is below 8, also indicating that it is significantly oversold.
My recommendation for Bitcoin investors
My recommendation for bitcoin investors depends on the average cost. For the true long-term enthusiasts, especially those with high average costs, holding is probably the best option. For those whose average cost basis is below $23,000, it may be prudent to take profits now as there is a high probability that you have an opportunity to re-enter at similar or lower levels if the market turmoil continues. I am currently lowering my “buy rating” on bitcoin to “hold/sell”. While I’m not entirely bearish on bitcoin, it’s wise to take advantage of price volatility in the crypto market. I believe cryptocurrencies will rally as the broader market stabilizes, but the near-term outlook is quite bearish. For those who are making profits I recommend taking profits, for those with significant unrealized losses it is probably the best play to hold for the long haul.
Conclusion
To sum up, the Elliott wave on the Bitcoin candlestick chart was invalidated with the break below the $33,000 support level (the low generated by wave 4). This is a strong bearish indicator, especially considering the poor state of the current market (inflation, rate hikes, falling indices). The support levels identified in the chart above should be closely monitored to gauge price action and potential trading points for day traders. I still recommend holding those that are in the red, especially if the unrealized losses are large. I believe that the crypto market will recover over time as it has in the past. For those that are potentially profitable, it is probably wise to take profits and try to re-enter at similar/lower prices. Nonetheless, Bitcoin’s price action today has confirmed strong bearish sentiment.
Learn Crypto Trading, Yield Farms, Income strategies and more at CrytoAnswers
https://nov.link/cryptoanswers
Comments are closed.