


More and more on-chain indicators are pointing to a critical point in the cycle change in the cryptocurrency and Bitcoin (BTC) market. Select indicators that have historically marked the start of a long-term bull market are starting to turn green.
BeInCrypto presents 3 on-chain signals recently presented by well-known analysts. These include the so-called on-chain value map, the realized capitalization and the long/short-term holder threshold.
Although each indicator monitors different Bitcoin blockchain activity, their long-term structure suggests cyclical change. In the past, these changes have been associated with the start of a cryptocurrency bull market. Interestingly, they usually occurred during historical halving events.
3 On-Chain Signals: Value Map
Bitcoin’s on-chain value map indicator was created by well-known analyst @therationalroot. It combines three other, more fundamental on-chain indicators: realized capitalization, liquidity supply and coin days destroyed.
By combining these three indicators, the analyst was able to generate a long-term range that appears useful in identifying the lows and highs of BTC price. This area takes the form of a 4-color band with a green median. It indicates the so-called “fair value” of Bitcoin. If the BTC price is near this line, the valuation of the largest cryptocurrency is neither overvalued nor undervalued.
Read more: Who will own the most Bitcoins in 2024?
On the other hand, if the BTC price deviates significantly from the “fair value”, Bitcoin is overvalued or undervalued. The two bands above green – yellow and red – are reached during bull markets when BTC is overvalued. In contrast, the following two bands – light and dark blue – are associated with bear markets and undervaluation of the BTC price.
On-chain value map. Source: X
In his post on X (Twitter), the analyst emphasizes that Bitcoin has just returned to the green “fair value” area. He goes on to say that reaching this level in the past has been accompanied by a sideways trend. This happened around the halving and signaled an accumulation phase before a mature bull market. But a moment later he adds:
“Note that fair value increases.”
If we look back at previous moments on the charts when “fair value” started rising (green circles), we see that this was definitely a bullish signal. In fact, after this event, there was a sideways trend for several months, which naturally turned into an upward phase. Furthermore, they appeared a few weeks before the halving.
The only exception to this is the COVID-19 crash in early 2020. This event culminated in a small bear market that proved to be an excellent buying opportunity before the previous bull market.
The realized market capitalization also increases
The second indicator that shows behavior similar to the on-chain value map is Bitcoin's realized market capitalization. This similarity is not surprising since this indicator represents one of the three components of the aforementioned index. However, it is worth noting that the long-term chart also shows a key moment of cycle change.
Realized market cap values different parts of the offering at different prices (rather than using the current daily close). Specifically, it is calculated by valuing each UTXO at the price when it was last moved. Therefore, this indicator is more accurate than just BTC market capitalization.
We see similarities in the realized capitalization chart going back to the first Bitcoin cycle. All 4 bear markets to date have resulted in a slight decline in realized capitalization and a multi-year sideways trend. Only the beginning of a new bull market was always correlated with a reversal on the indicator's chart, which started to go up (green circles).
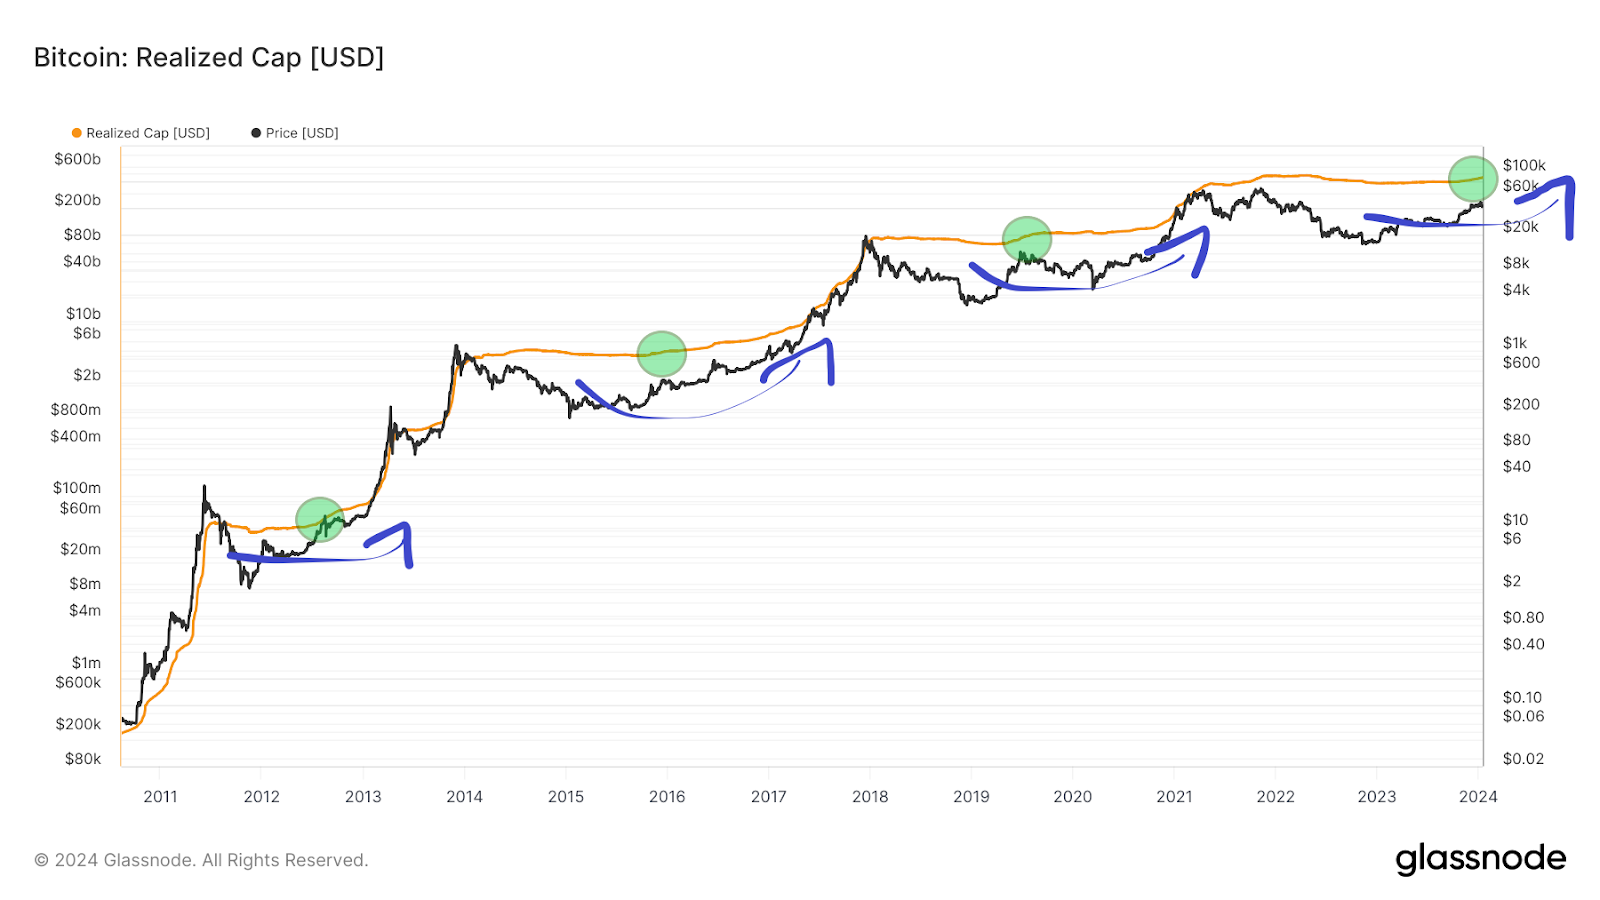
Additionally, multi-year sideways trends appear to resemble a broad, rounded bottom (blue arrows).
The realized capitalization is currently showing an upward trend again. This signals a change in the long-term trend and is a strong signal of an impending bull market. This indicator – like the on-chain value map – historically changes direction around the BTC halving.
On-Chain Signals: Long-term holders start selling
Finally, the final on-chain signal we chose for today’s analysis was posted on the official X account of data provider Glassnode. This is the so-called long/short-term holder threshold.
The graph of the indicator shows two curves corresponding to the resources held by long-term (blue) and short-term holders (red). The historical relationship between the two charts is clear. Mature bull markets are characterized by a sharp decline on the blue line and a rise on the red line. In other words, during a period of rapid rise in BTC price, long-term holders sell their assets to short-term market participants.
Read more: What is a Bitcoin ETF?
However, the situation changes quickly after the Bitcoin price peaks. Then short-term investors panic and sell in favor of long-term investors.
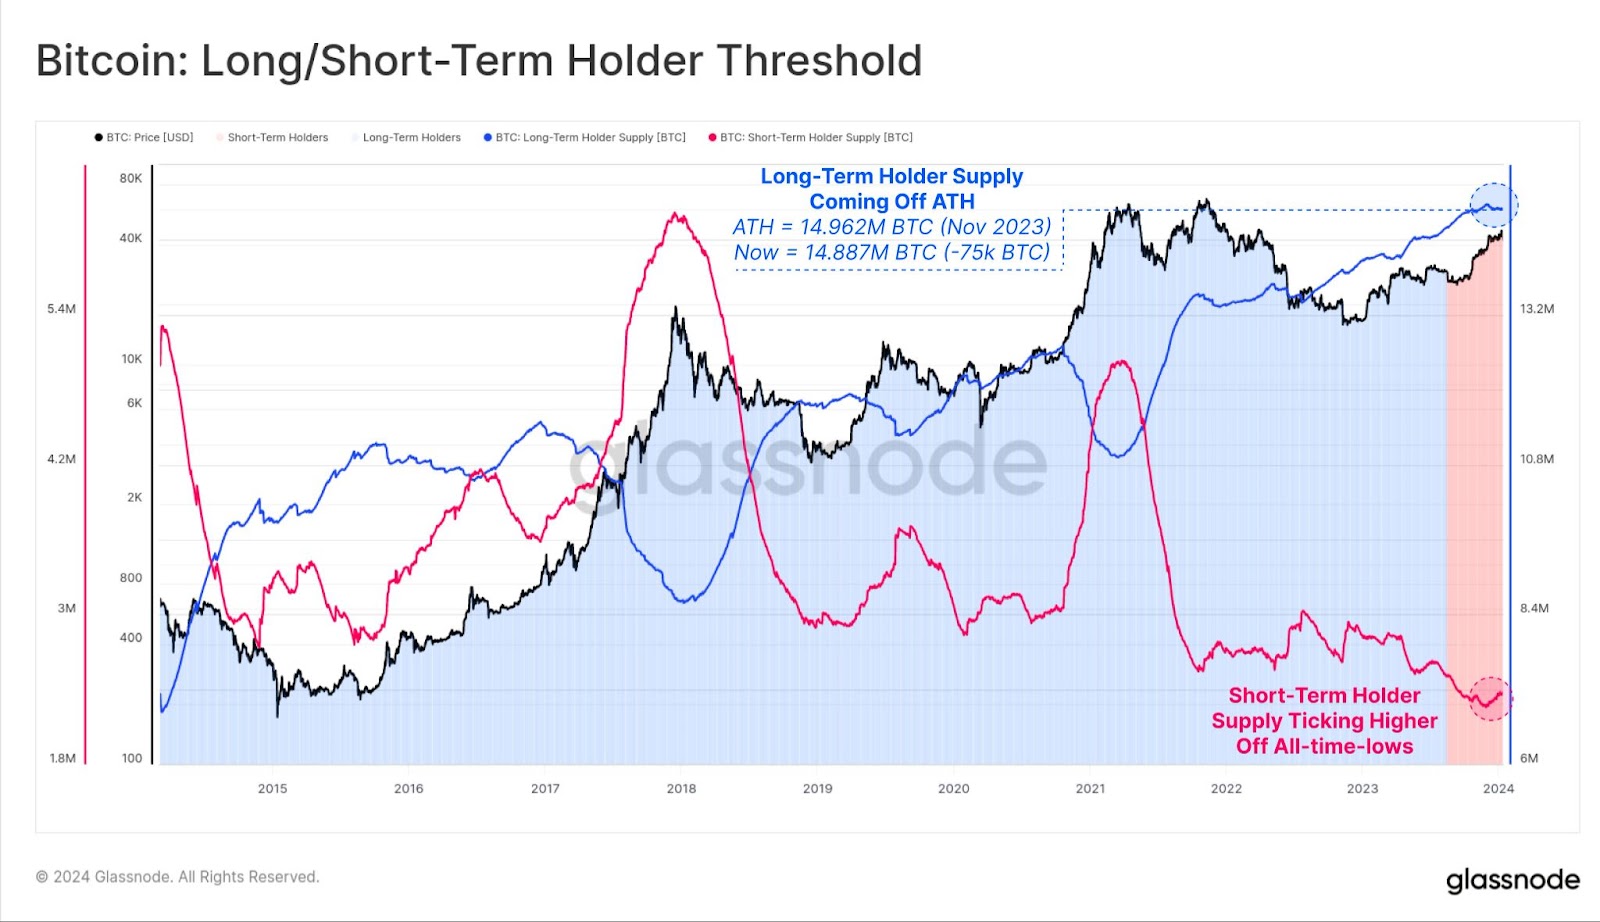
Glassnode analysts note that the current threshold situation is unique for long/short-term holders. The blue line recently reached an all-time high (ATH), while the red line just bounced off an all-time low (ATL).
This suggests that we may be witnessing a cyclical trend reversal on the chart. If short-term holders start accumulating their holdings of Bitcoin, it could be a sign of an impending bull market.
But regardless of when this trend reversal occurs, a change in the long-term chart appears to be only a matter of time. Investors with diamond hands are usually patient and do not sell at a loss.
For BeInCrypto's latest crypto market analysis: Click here.
Disclaimer
In accordance with Trust Project policies, this pricing analysis article is for informational purposes only and should not be considered financial or investment advice. BeInCrypto is committed to accurate, unbiased reporting, but market conditions are subject to change without notice. Always do your own research and consult a professional before making any financial decisions. Please note that our Terms and Conditions, Privacy Policy and Disclaimers have been updated.
Learn Crypto Trading, Yield Farms, Income strategies and more at CrytoAnswers
https://nov.link/cryptoanswers
Comments are closed.