


Disclaimer: The information presented does not constitute financial, investment, trading or any other type of advice and solely represents the opinion of the author
- Litecoin fell into a zone of strong support from the middle bullish order block and a high volume node
- This could still fail if Bitcoin stumbles below $16.2K in the next few days
Litecoin [LTC] provided a slightly risky buying opportunity on the price charts. Risk-averse traders should await trading on Dec. 19 to set direction for Litecoin in the week ahead. However, the trend has been declining in recent days.
Read Litecoins [LTC] Price prediction for 2023-24
In late November, Litecoin retested the previous range highs as support and bulls attempted to push prices back above $80.65. Their efforts met with greater selling pressure. The Weakness of Bitcoin [BTC] saw Litecoin lose $73.4 as support.
Litecoin falls back into the range: Can the bulls defend $60?
Source: LTC/USDT on TradingView
Litecoin has been trading in a range of $73.4 to $50.2 since June. The midpoint of this range was $60.5. This level also has a confluence with a bullish order block on the daily time frame that LTC formed on Nov 21st.
Therefore, a bullish trader can look for entries into a long position in the $60-$64 range. A swing failure pattern on a lower timeframe and a bullish trend reversal could be one such trigger to watch out for.
The idea that buyers still have some strength came from On-Balance Volume (OBV). This indicator has been making higher lows since mid-June. However, the recent sell-off forced OBV to break through its structure. It remains to be seen whether demand will pick up again. Invalidating the idea of a recovery from the mean would be a daily session close below $59.4. In this scenario, the bias would have turned bearish.
The Relative Strength Index (RSI) also fell sharply below the neutral 50 to indicate bears were dominant. The VPVR tool showed the point of control at $54 and marked it as a support level should LTC fall below $59.4. The value area high at $70 can serve as resistance in the event of a bounce. The $61.7 area was a high volume node, making it a support zone next to the middle and bullish order blocks.
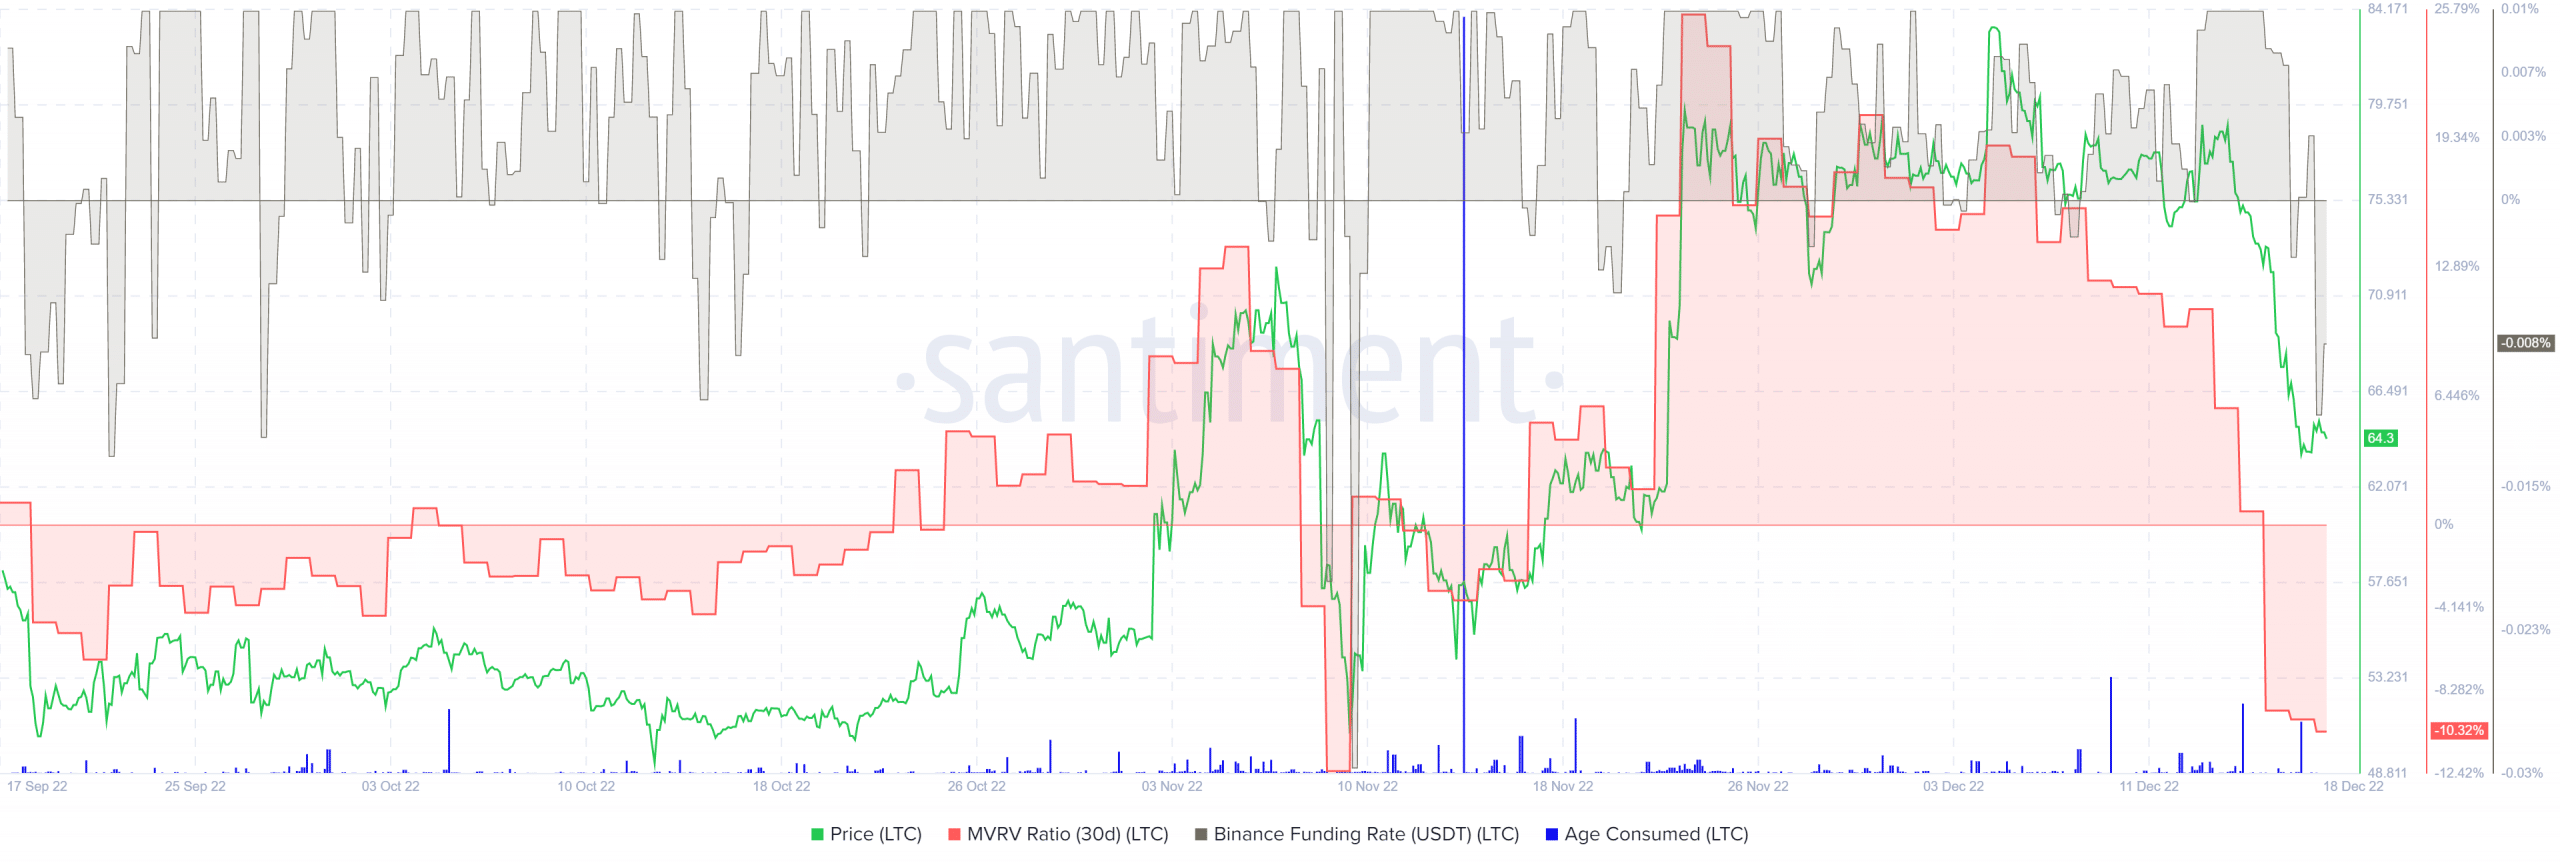
Funding rate was negative in response to the sharp decline and MVRV was also hurt
Source: Santiment
The Market Value to Realized Value (MVRV) ratio (30 days) has been well above zero since Nov. 17, after Litecoin surged from $60 to $70.44. In the weeks that followed, MVRV slowly weakened and recent losses forced the metric into negative territory. This once again showed short-term holders at a loss. The funding rate was also heavily negative, showing that sentiment towards the asset in the futures markets was bearish.
In the meantime, there hasn’t been a big spike in the age consumed metric. Consumed age was larger during the December 10 retest at $73.4 as support. The conclusion from this metric alone was that a rebound might be possible as selling was not as intense as the price charts made it appear.
Comments are closed.