

![Uniswap [UNI]: Bears could break out below $5.267, but...](https://i0.wp.com/trading-u.s3.amazonaws.com/wp-content/uploads/2023/01/07001736/fi-unsplash-ben-1000x600.jpg?fit=1000%2C600&ssl=1)
Disclaimer: The information presented does not constitute financial, investment, trading or any other type of advice and solely represents the opinion of the author.
- UNI was in a correction and could drop below $5.267.
- A break above the resistance at $5.417 would invalidate the forecast.
Uniswap [UNI] has seen two successful rallies since the market crash in November 2022, each hitting $6.5. However, the recent recovery only reached $5.5 before turning into a correction.
read Uniswap [UNI] price prediction 2023-24
At press time, UNI is trading at $5.323 and threatening to fall below the $5.267 support. Although such a move lower could offer short traders additional gains, technical indicators (12-hour chart) and whale movements urged caution.
Support at $5.267: Was a Break Below Likely?
Source: UNI/USDT on TradingView
In the second phase of UNI’s rally, the token hit $6.5 in early December 2022 after hitting a low of $5.0 in November 2022. It then followed a downtrend and formed a falling channel before falling into a range below.
UNI has been trading in the $4.967-$5.417 range since mid-December and only broke through on Jan. 4, 2023 after a massive BTC rally on the same day. The patterned breakout allowed UNI to reach the 100-period EMA of $5.609 before a correction ensued.
The RSI, CMF and MFI indicators retreated from the upper ranges, suggesting that buying pressure was easing, buyers lost significant leverage and distribution was underway.
Therefore, UNI might decline, breaking the $5.267 support and settling at $5.130. The level could serve as a target for short selling.
However, the RSI has yet to fall below the 50-level midline and the CMF has yet to fall below the zero level, which would give the bears more leverage. A rejection of these indicators in the middle would favor the bulls.
If the bulls gain traction and break the resistance at $5.417, the above bearish bias would become invalid. Such a bounce would allow UNI bulls to target the 100-period EMA at $5.596.
Behind the recent selling pressure was the most dominant whale supplier
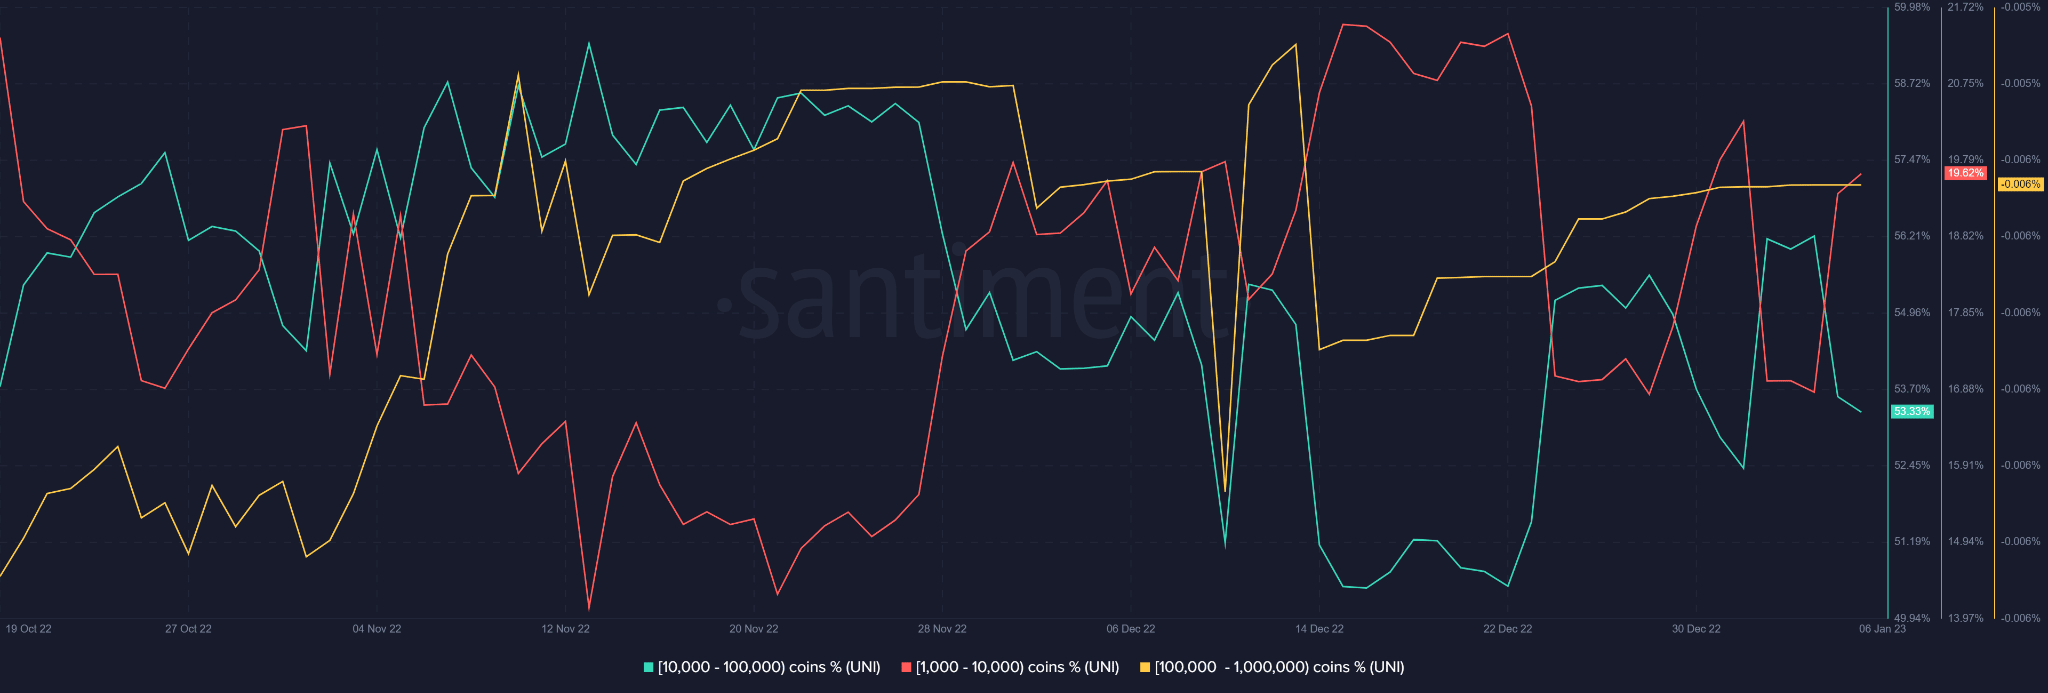
Source: Santiment
According to Santiment, the dominant provider category controlled 53% of the total supply and owned between 10,000 and 100,000 UNI coins.
This dominant category was responsible for the recent selling pressure while the next influential category (1,000 – 10,000 coins) piled up with 19.5% control.
So at press time, the dominant player in the market was calling the shots and investors could follow suit to minimize risk.
Are your stocks flashing green? Check the UNI earnings calculator
UNI’s open interest (OI) remained flat as the price tumbled lower
According to Coinglass, the divergence between OI and UNI price on Jan 2nd was followed by UNI price hike on Jan 4th. UNI Binance exchange open interest rates fell on Jan. 5 after a fall in UNI prices.
However, OI was flat on January 6th as UNI prices fell even further. Demand on the futures markets thus remained unchanged despite the fall in prices.
Although this could indicate a possible change in momentum, investors should consider the RSI, CMF and BTC movements to get a clear probable trend reversal before closing their positions.
Comments are closed.