


chontich what
By David Brady
Gold came under pressure this week after higher than expected CPI. Although that was the trigger, there were signs that this was coming.

Gold paused at its downtrend resistance in red and its 1740 resistance in blue, a powerful confluence. After such a long decline and so many attempts to break 1675, it was a magnet for the Bullion Banks to take the stops below before there could be a reversal to the upside. That’s exactly what happened on Thursday.
However, now we have a positive diverging lower low across all indicators. This is the ideal scenario that I originally predicted back in July 2021.
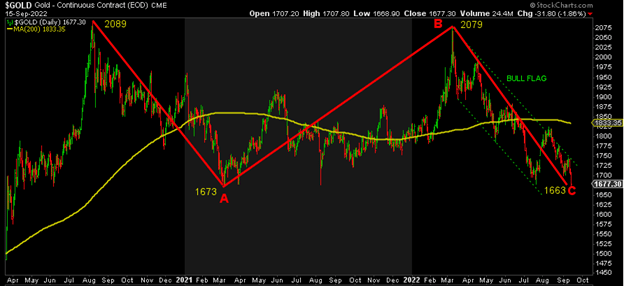
The wave 4 ABC correction I predicted at the time is also basically complete, with the risk of a next dip by 1663, where wave C is the same size as the drop in wave A. If this correction is indeed complete, wave 5 to 2300+ is next.

The weekly chart also confirms the positive diverging lower low on both the RSI and MACD histogram in blue. The MACD line at the bottom of the chart is at its lowest level since December 2016 when gold was at 1124. Think about it! It’s also lower than 1450, the March 2020 low, and 1167, the August 2018 low. The last time it was more oversold was in 2013, nine years ago.
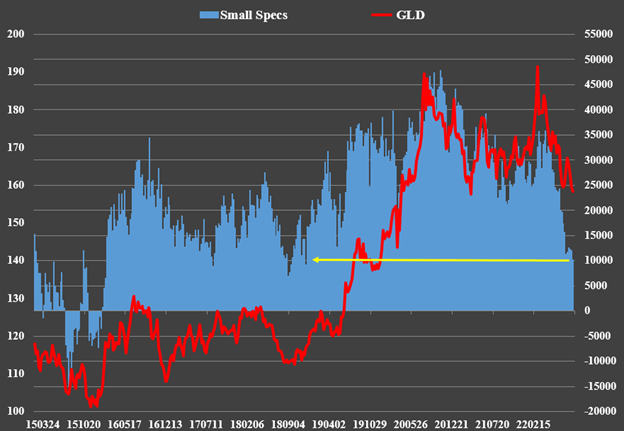
Mood is also in the sewers, a wonderful contrarian indicator. The funds have taken net short positions in gold for the first time since 2019 when gold bottomed in the 1200 area. Small speculators – ie retail, the so-called “dumbest money” – have their lowest net long position since December 2018. Both funds and small specs are almost always wrong at the extreme.
The 10-year nominal yield just hit a negative divergent double top at ~3.50 with a risk of a few basis points higher. The 10-year real yield just hit 1.05%, the highest since 2019. The risk/reward trade-off is skewed to the downside on yields, in my view. In the meantime, it looks like the DXY is finally running out of steam after several negatively diverging higher highs on both the weekly and daily charts. However, I’m not ruling out a surge to 113 before a larger dump occurs.
Meanwhile, China and India in particular continue to load physical gold. Bridgewater joins the party by buying into three physically-backed gold ETFs in China. Silver is withdrawn from the SLV ETF, LBMA vaults and COMEX futures markets. Physical metal inventories are drying up sending premiums over spot up to 50%, more than triple their normal levels and higher than in April 2020 when Swiss Gold’s refineries were closed due to Covid. India recharges physical silver based on import data.
All we’re waiting for is for the Fed to just stand still. But gold and the rest of the sector may not wait for the inevitable any more than they did in November 2018 and October 2008 before massive fresh QE volumes months later.
As I always say, don’t try to catch a falling knife, wait for a break in resistance. That resistance sits at 1740 unless gold falls much further, then 1680 becomes the resistance that breaks. Then look for a higher low followed by a higher high to signal that the bottom is in. Until then, the trend remains downward for the time being. Whenever this ground enters, a huge amount of fuel is accumulated for what follows.
Original post
Editor’s note: The summary bullet points for this article were selected by Seeking Alpha editors.
Comments are closed.