
Take a look at Bitcoin’s historically low volatility periods to find out what 2023 has in store


- Volatility, or lack thereof, can serve as a tool for analyzing market trends
- Bitcoin’s downtrend is mostly complete, but another leg down could be painful
Bitcoin [BTC] Investors have had some rough times throughout 2022. Investors and traders who have witnessed the Celsius, Terra and FTX crises (among so many other events) have seen history unfold before their eyes.
All of this history is revealed in the price charts and it is possible that we can prepare for the worst case scenario by studying these charts. Look to the past to understand the future, as a famous person probably once said.
Read Bitcoins [BTC] Price prediction 2023-24
Worth noting are the periods when volatility disappears. For assets like Bitcoin, a drop in volatility often heralds a massive move around the corner. One of the simpler tools to measure how volatile an asset is on price charts is the Bollinger Bands.
Bollinger Bands width indicator results
Bollinger Bands is a tool developed by John Bollinger. It has two bands plotted with one standard deviation above and below the price (based on the last 20 periods). These ranges adjust based on the volatility of the price of the underlying asset.
Source: BTC/USDT on TradingView
When the width of the Bollinger Bands decreases, it indicates a period of lower volatility or contraction on the price charts. This generally underscores an accumulation phase before a strong move higher, especially on higher timeframes. However, it can also indicate phases of distribution before further downward movement occurs once buyers are exhausted.
On the daily timeframe, the Bollinger Bands width indicator was reading 0.09 at press time. It had fallen to a low of 0.07 on December 1st and 0.06 on October 25th. Previously, the BB width indicator touched these levels on the daily timeframe of October 8, 2020.
Extremely low values were also recorded on other dates in 2020, such as August 26 (0.07), July 15 (0.04) and September 21, 2019 (0.06).
Expansions north followed reduced volatility
History doesn’t repeat itself, but it rhymes. Any technical analysis is based on patterns that repeat themselves over and over again. The October, August, and July contractions of 2020 came right before the recent bull run that saw Bitcoin plummet as low as $69,000.
However, at the time of writing, Bitcoin was in the depths of a bear market winter. Throughout 2023, Bitcoin may not initiate a strong trend towards higher timeframes like that seen in late 2020 to mid-2021.
Hence, there is a need to find times when volatility dried up after Bitcoin retraced most of its gains from a bull run. This happened in late 2018 and early 2019.
Source: BTC/USDT on TradingView
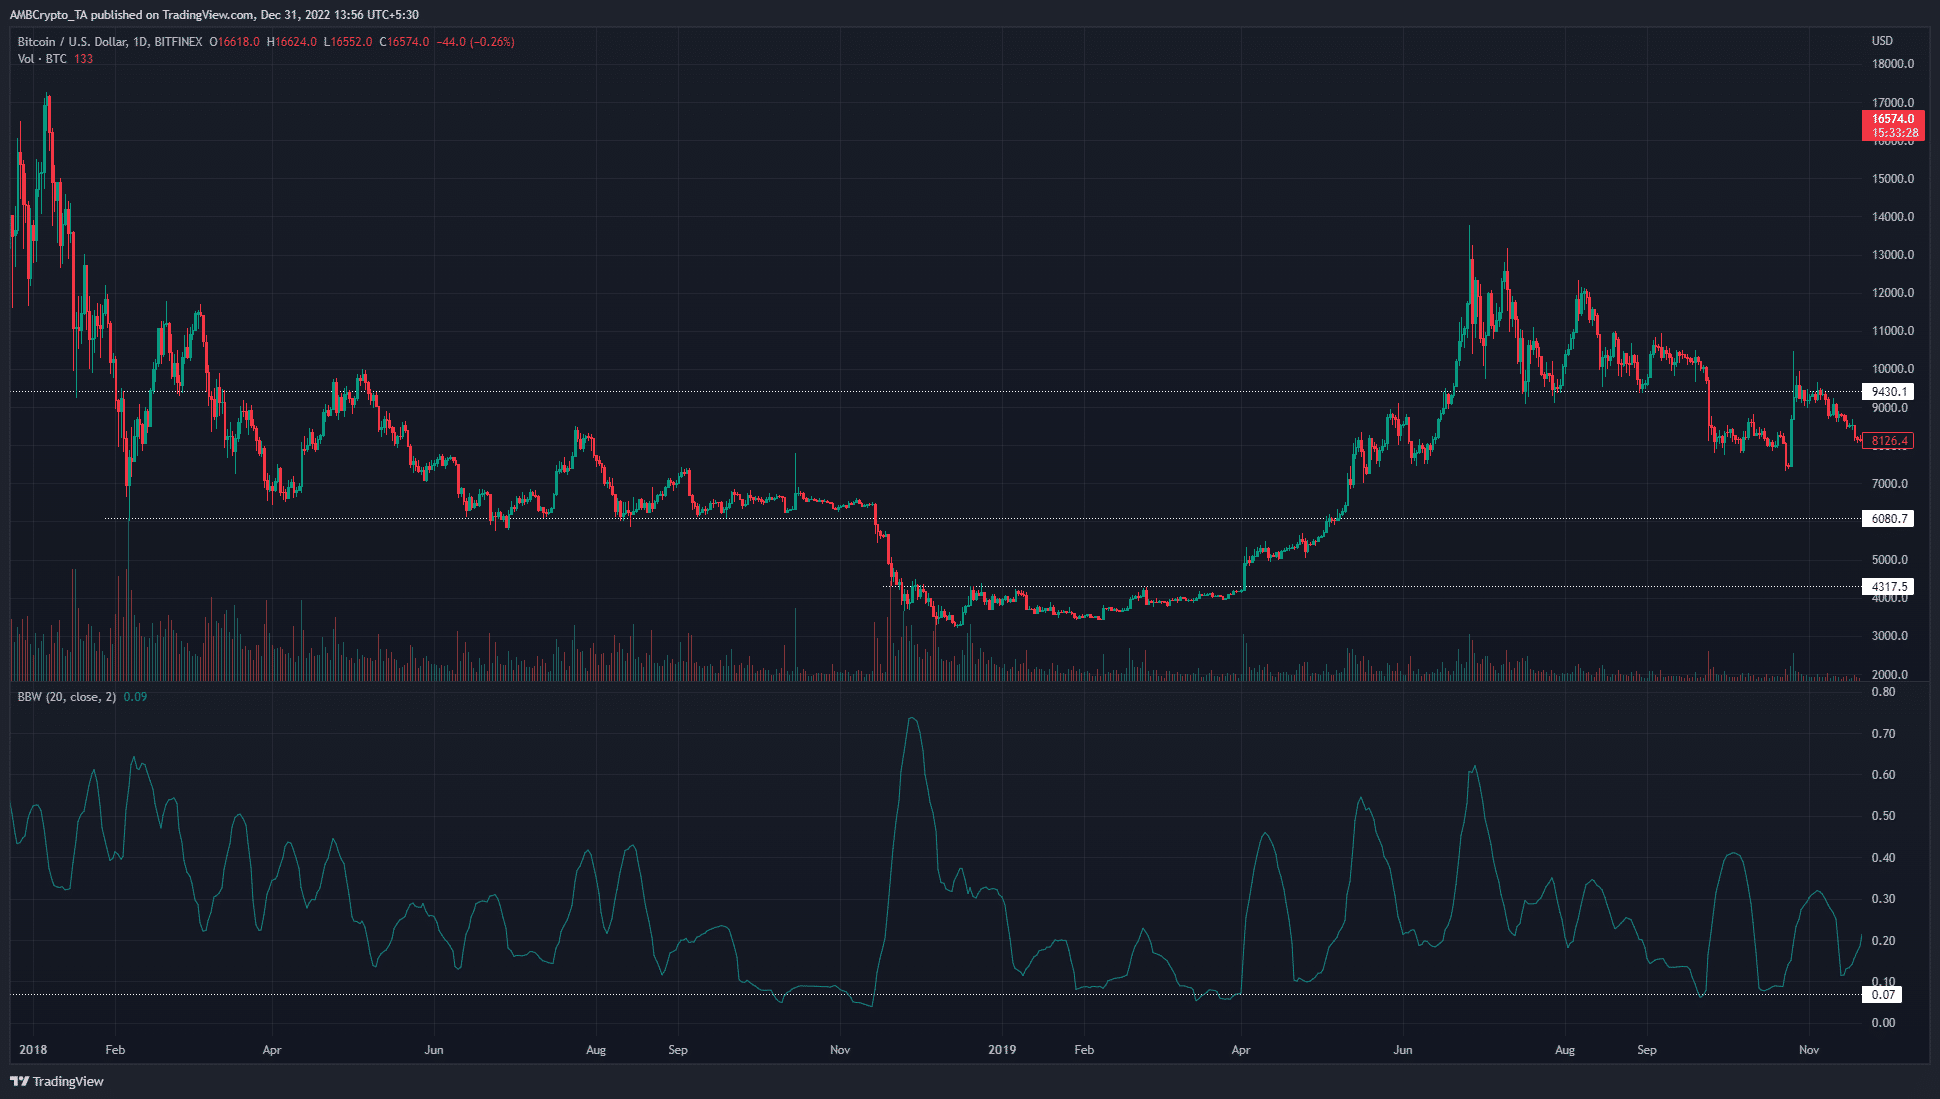
The chart above shows the late 2017 rally to $19.5k and subsequent retracement in 2018. During the downtrend, volatility was almost dead in September and October 2018.
The BB width indicator consistently showed values of 0.08 and 0.09. However, another steep drop from $6,000 to $3.3,000 followed. From December 2018 to March 2019, bulls fought for their lives to push prices back above $4.3K.
When this resistance was finally broken, a rally to $13,000 ensued. Hindsight tells us that this wasn’t a real bull rally. Still, it was an impressive move north of 220% in less than 90 days after breaking through $4.3K.
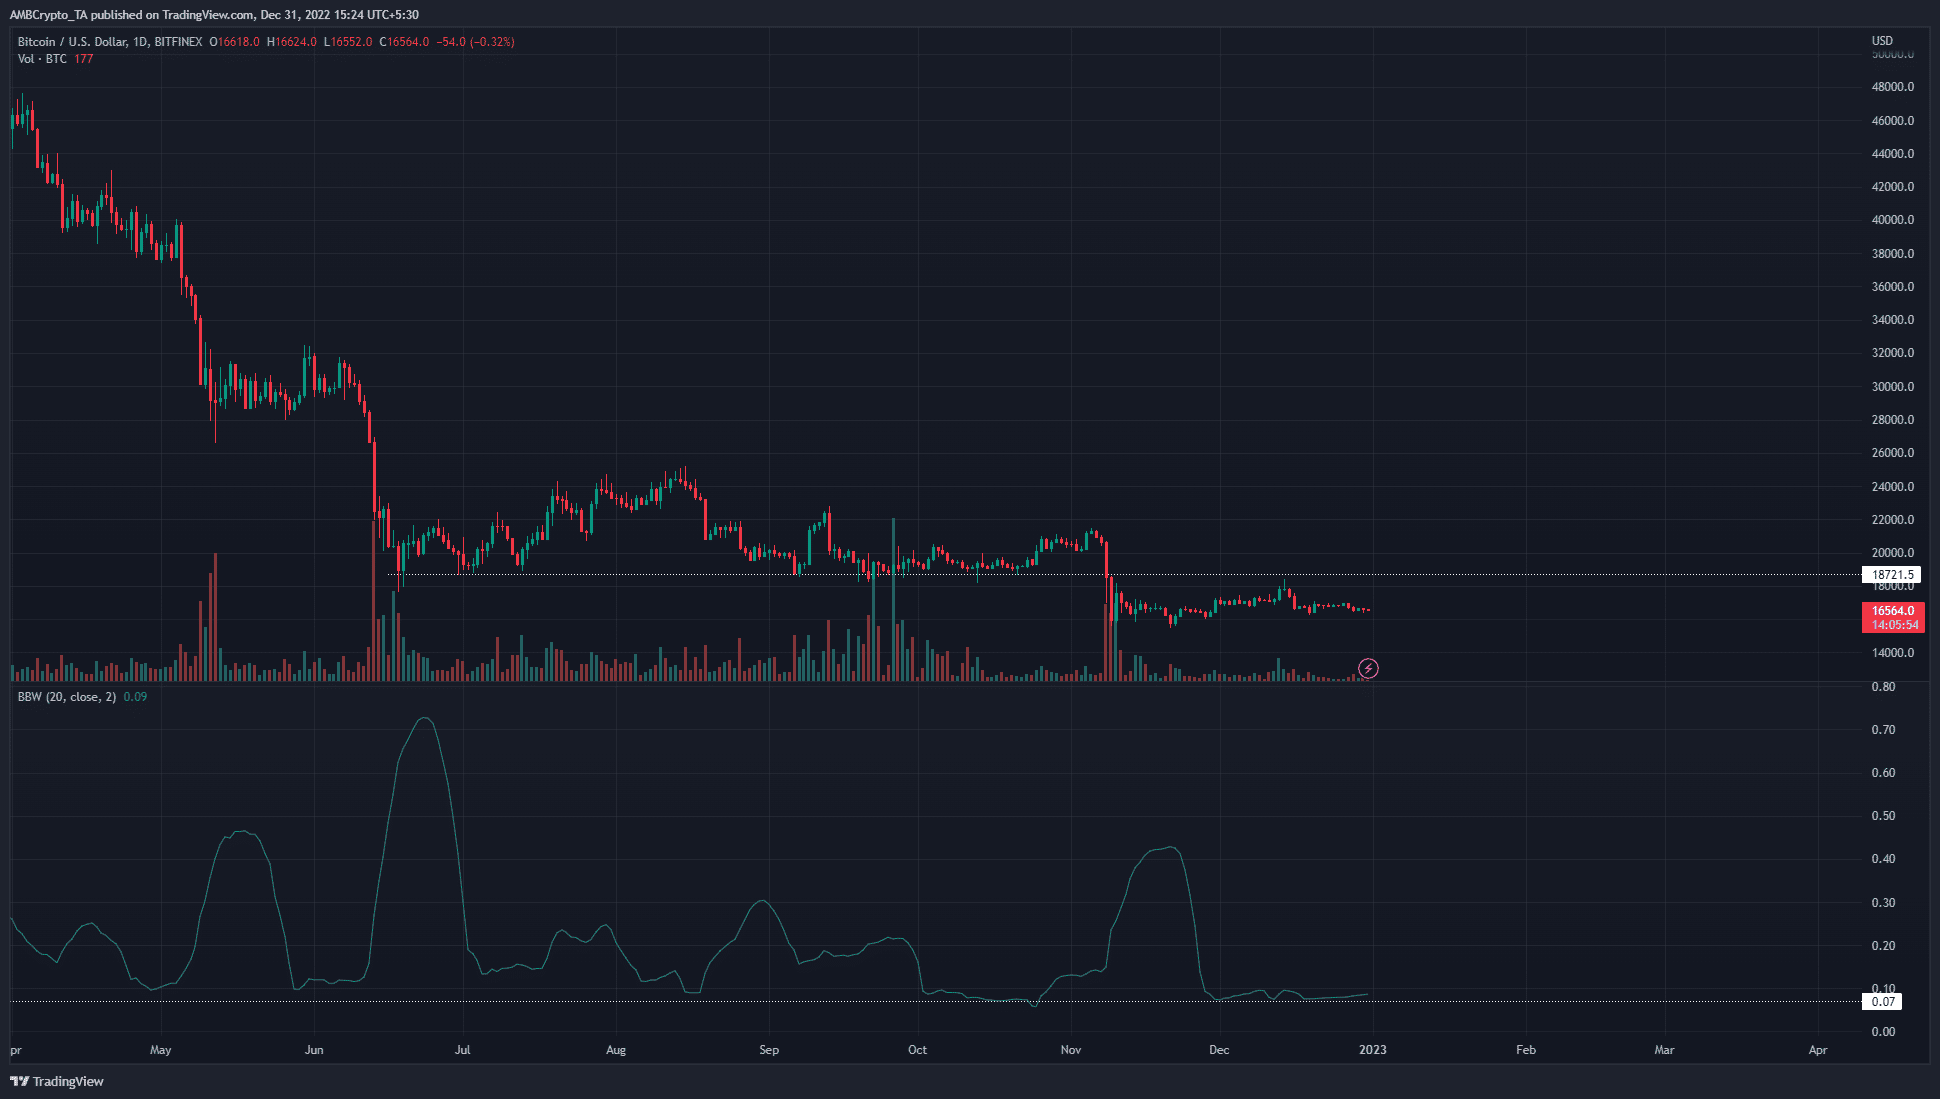
Therefore, the conclusion was that low volatility does not automatically lead to a long-term bottom. At the time of writing, bitcoin has lost the $18.7k level and another drop towards $10k may occur, just like it did in late 2018.
Source: BTC/USDT on TradingView
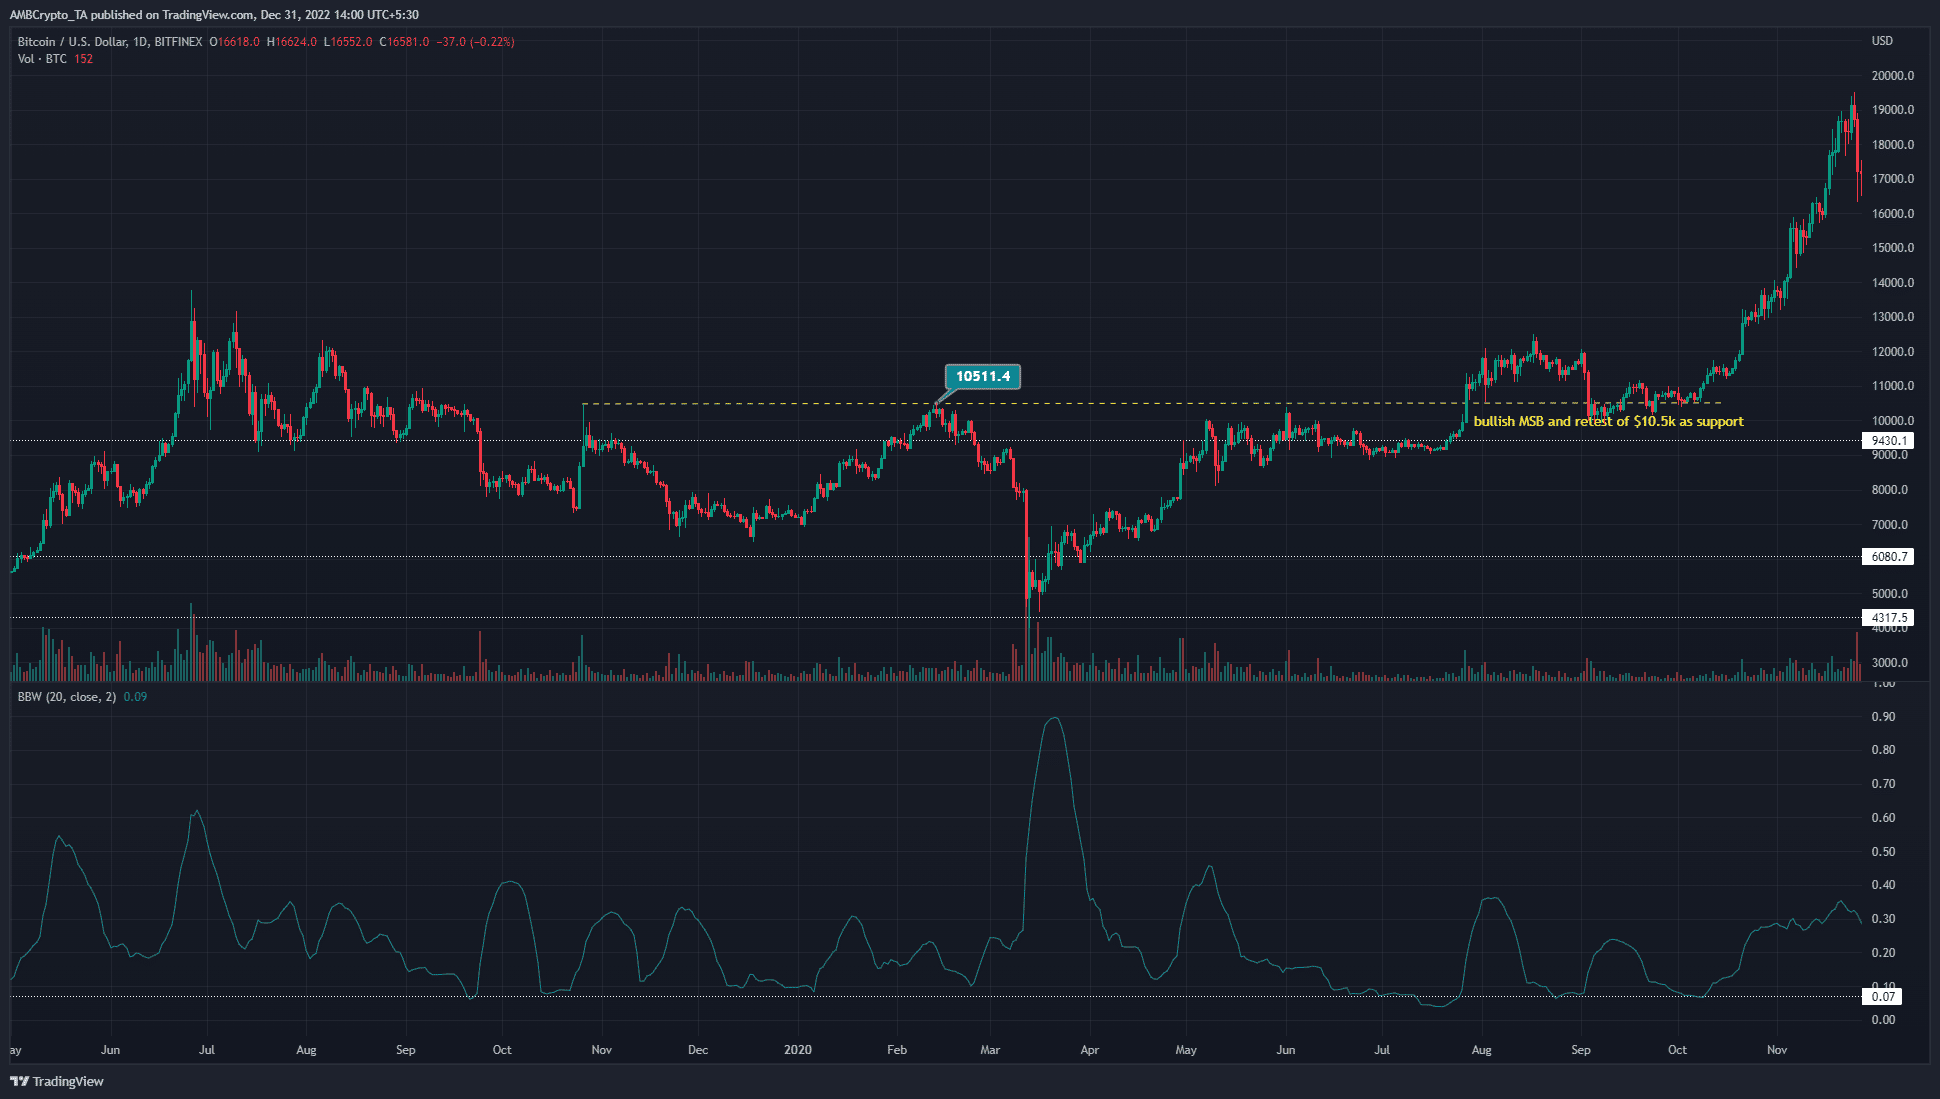
This rally peaked at $13.7k in June 2019 and declined over the following months. In September 2019, volatility dropped to 0.06, but it wasn’t until the COVID-19 crash before markets found a long-term bottom and reversed.
Market structure breaks could be the key to identifying rallies
Despite the bounce from $4.3k, BTC was not in a reversal. This lasted until the higher timeframe bearish market structure was broken, as highlighted in the chart above. A move back above $9,000 turned the longer term bias in favor of the bulls and a break above $10.5,000 showed bullish strength.
What can we learn from this series of events? Compared to the present, volatility was low and the trend was down, just like it was from August to October 2018. From June to November 2018, the $6,000 level was rock solid until it wasn’t anymore and prices crashed again on 46 %. Can the same develop beyond 2023?
Source: BTC/USDT on TradingView
Is the $18.7K level the line in the sand that was $6K in 2018? $18.7K was defended as support for 144 days from June to November 2018.
This was similar to defending $6,000 from June to November 2018, except that $6,000 was tested as support back in February 2018.
Now that $18.7K was lost, it was likely that more losses could follow. Long-term BTC bottoms usually form abruptly after months of foreboding.
Another crash like the one we saw in the outbreak of the coronavirus pandemic or in November 2018 would be necessary to force billions of dollars in liquidation before markets can march higher.
Using heat map data on liquidation levels from Hyblock, an anonymous analyst hypothesized on Dec. 29 that $15,000 and $13,000 are the two most important liquidation levels, with $50 billion worth of liquidations near the $13,000 level have to be hunted.
$BTC – @hyblockcapital’s heatmap shows 2 major liquidation levels between the 13,000 and 15,000 I mentioned earlier.
As shown in the previous tweet, if we can wipe out all that liquidity in a wedging fashion, I have a very good chance of a significant bounce.
13k to 30k hopefully. https://t.co/dm78uFuH40 pic.twitter.com/3HiqRCmG49
— TradingHubb (@TheTradingHubb) December 29, 2022
The price is looking for liquidity and this area might be too juicy to leave unattended. A drop below $15.8k could cause the already fearful market conditions to ripen into panic.
Forced sellers on both the spot and futures markets could keep prices falling and end in a liquidation cascade.
Patience is likely to be rewarded, but all-time highs are unlikely to be reached in 2023
In the event of a dip to $13k-$13.8k, buyers can expect a return above $15.8k and $17.6k and expect a rally, possibly a reflection of mid-2019. As always, it might not be replicated exactly, and caution would be key.
Are your BTC holdings flashing green? Check the profit calculator
It was not certain or even necessary that $13,000 would mark the bottom. The heatmaps and rally highs from mid-2019 show convergence at this level.
If BTC instead fell another 46% below the $18.7K support, investors could consider $10K as a region where the bottom could form. In which direction the dice would roll was uncertain.
There were 641 days between Bitcoin collapsing below the $6,000 support level in late 2018 and retesting $10.5,000 as support in Q3 2020. 641 days after November 10, 2022 makes August 12, 2024. However, every cycle is different and all a trader or investor can control is the risk they take.
Above is a scenario where the central theme is liquidity and volatility. When volatility takes a vacation, so does liquidity. A large, violent step may be necessary to shake even the fanatics out of their positions.
Only then could the market reverse itself. In this Shark Eat Shark game, the patient and the prepared survive and benefit.
Comments are closed.