
Adaptability of water resources development and utilization to social-economy system in Hunan province, China


Spatiotemporal evolution characteristics of the composite system
Temporal evolution characteristics of development index
The variation in the development indices for each subsystem of Hunan Province is shown in Fig. 5. When calculating the development index, the combined weights of indicators C1–C10 in the WRS were determined as follows: 0.060, 0.076, 0.069, 0.076, 0.079, 0.135, 0.090, 0.092, 0.231, and 0.091. The combined weights of indicators C11–C22 in the SES were determined as follows: 0.065, 0.063, 0.054, 0.100, 0.107, 0.059, 0.064, 0.132, 0.078, 0.143, 0.065, and 0.070.
Figure 5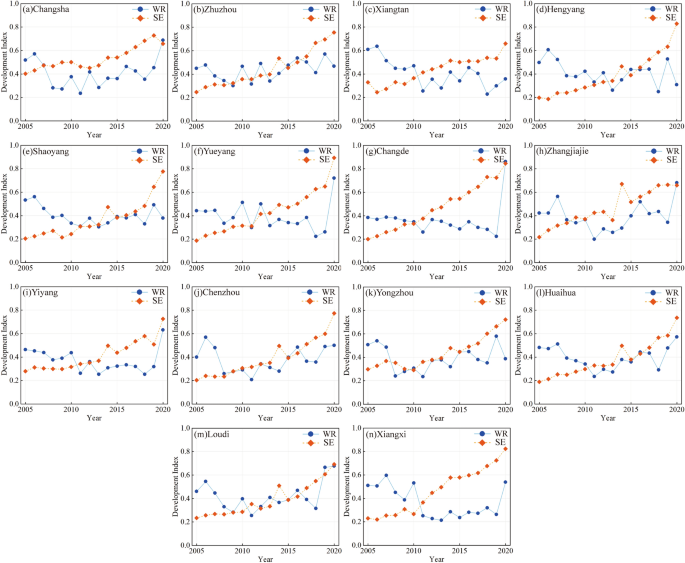
Interannual variation trend of the development index in Hunan Province from 2005 to 2020.
The annual variation trend of the WRS development index in Hunan Province from 2005 to 2020 shows significant fluctuations across different cities over 16 years. The variation trend of the WRS in most areas of the province can be divided into three stages: a noticeable decline from 2005 to 2008, fluctuation within the range of 0.2 to 0.6 from 2009 to 2016, and significant changes occurring from 2017 to 2020. The WRS is primarily influenced by local water resource endowment, the level of development and utilization, water consumption structure, and water-saving policies. The implementation of the “Opinions on Implementing the Strictest Water Resource Management System” issued by the State Council in 2012 effectively controlled the degree of water resource development and utilization in Hunan Province, resulting in a decline and fluctuation in the WRS development index in most cities.
From 2005 to 2020, the annual variation trend of the SES development index in Hunan Province showed an overall significant upward trend in most cities. Since 2005, most areas of the province have experienced a continuous upward trend in the SES development index. After reaching the first peak during the years of 2013–2015, the index continued to rise. Apart from Changsha and Zhangjiajie cities, which reached their highest values in 2019 and 2014, respectively, the other cities in Hunan Province reached their peak values in 2020. In 2020, four cities had SES development indices exceeding 0.8, reaching the “excellent” level. For most cities in Hunan Province, the total GDP has increased by about six times between 2005 and 2020, indicating the robust development of secondary and tertiary industries. This has significantly contributed to the rise in the SES development indices across various cities.
Spatial evolution characteristics of development index
According to the spatial evolution of the WRS development level in Hunan Province from 2005 to 2020 (Fig. 6), most areas of Hunan Province exhibited a “fair” or higher level in 2005–2006. From 2007 to 2014, the accelerated industrialization in Hunan Province had a significant adverse impact on the efficient utilization of water resources, resulting in a downgrade of the WRS development level from “fair” to “poor” in most areas of the province. Among them, the minimum precipitation in Hunan Province from 2005 to 2020 occurred in 2011, and during this period, the production methods were relatively extensive. The decrease in precipitation and water pollution issues led to a “poor” water resources development level in all cities of Hunan Province in 2011, representing the lowest level during the period of 2007–2014.
Figure 6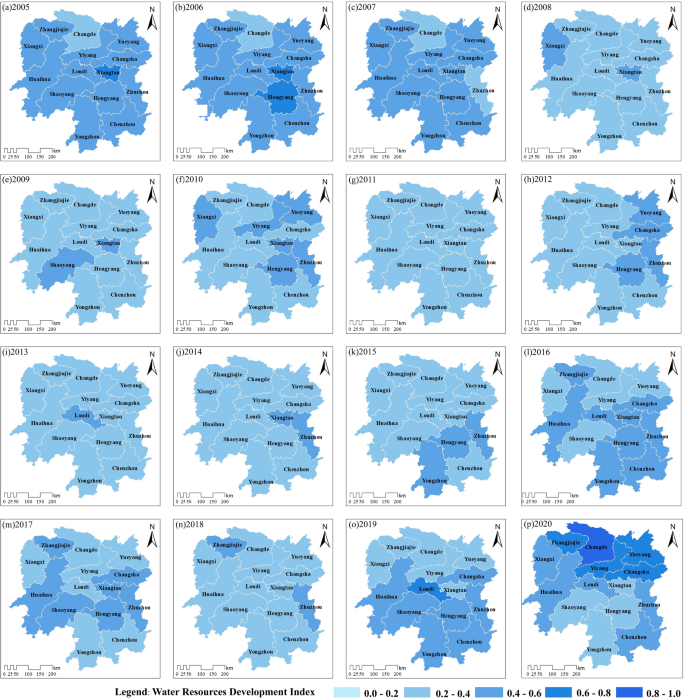
Spatial distribution of the WRS development level in Hunan Province from 2005 to 2020. Graphed by ArcGIS 10.2 and Adobe Illustrator 2021.
Since 2015, Hunan Province has successively introduced and vigorously implemented a series of water environment restoration policies, including the “Five Major Special Actions for the Comprehensive Treatment of the Dongting Lake Water Environment”, the “Three-Year Action Plan for Ecological and Environmental Restoration”, and the “Eight-Year Plan for Comprehensive Water Environment Governance”. These policies have effectively promoted the overall development of the WRS in the province toward a higher level from 2015 to 2020. In 2018, there was a brief decline in the overall development level in the province, with most cities exhibiting a “poor” level. In 2019, there was some improvement in the southern region of Hunan Province. By 2020, most cities had moved away from the “poor” stage, and it was evident that the WRS development level in the northern part of the province was generally higher than that in the southern part.
From the spatial evolution of the SES development level in Hunan Province from 2005 to 2020 (Fig. 7), Huaihua, Yueyang, and Hengyang cities had SES indices below 0.2 in 2005. The overall development status of the province during this period was its lowest between 2005 and 2020. In the years 2006–2007, Huaihua, Yueyang, and Hengyang cities gradually surpassed the 0.2 threshold in their development indices, indicating a slight improvement in their development status from “poor” to “fairly poor.” From 2007 to 2010, most cities remained at a “fairly poor” level for an extended period. During the years 2011–2015, the SES development level in Hunan Province exhibited an uneven and unstable pattern between the north and south regions. In 2014, the overall development level of the province reached “fair”, showing a brief improvement.
Figure 7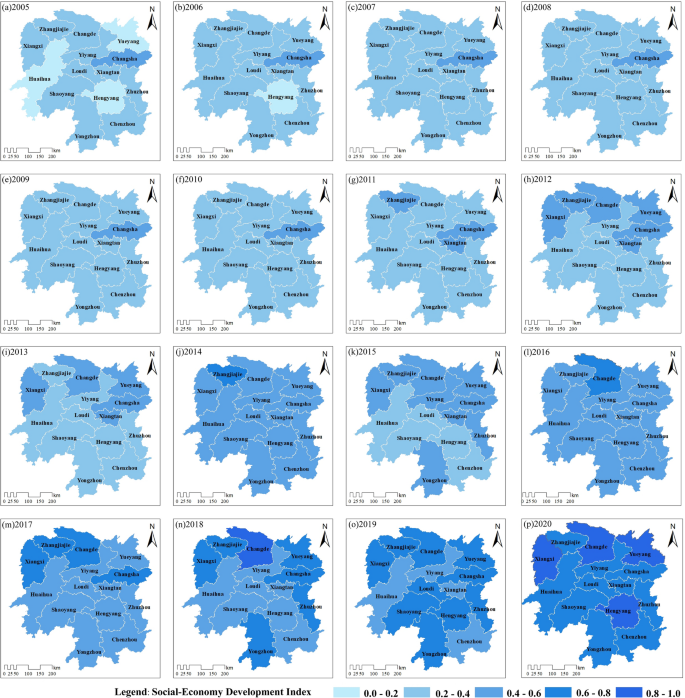
Spatial distribution of the SES development level in Hunan Province from 2005 to 2020. Graphed by ArcGIS 10.2 and Adobe Illustrator 2021.
From 2016 to 2020, due to the accelerated industrial upgrading in Hunan Province, the overall SES development level continued to rise, reaching its highest level within this period in 2020. Apart from cities such as Xiangxi, Changde, Yueyang, and Hengyang, which achieved an “excellent” level in 2020, the remaining areas reached a “good” level. Since the 18th National Congress of the Communist Party of China, under the strong leadership of the Party Central Committee with Comrade Xi Jinping at the core, the entire province has vigorously promoted scientific development, providing strong support for rapid social-economy development.
Spatiotemporal evolution characteristics of the coupling coordinative degree in the composite system
Temporal evolution characteristics of the coupling coordinative degree
The trend of the coupling coordinative degree (CCD) in the province was influenced by the development index of water resources and could be broadly divided into three stages: 2005–2008, 2009–2016, and 2017–2020. As shown in Fig. 8, the average CCD in most cities and counties during these three stages showed a gradual improvement.
Figure 8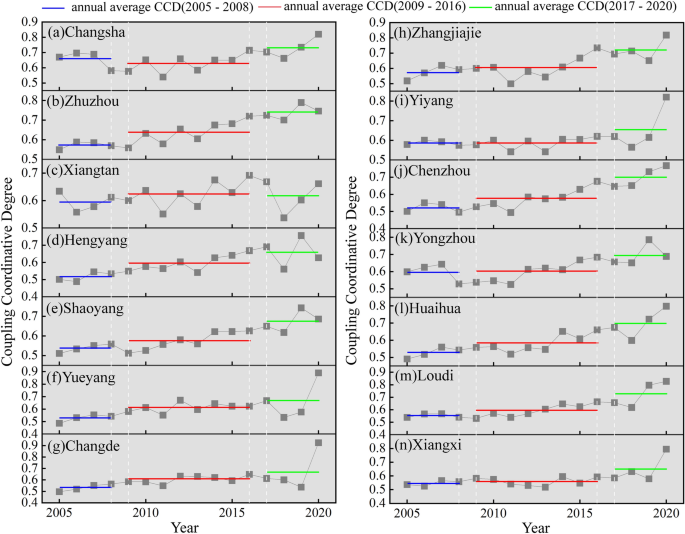
Interannual variation trend of the CCD in Hunan Province from 2005 to 2020.
According to Fig. 8, from 2005 to 2013, most cities and counties in Hunan Province were either in a state of coupling imbalance and decline or fluctuating around the threshold of coordination. In 2013, to implement national energy-saving and emission-reduction policies, Hunan Province actively formulated relevant supporting measures, strictly controlled the development and utilization of water resources, phased out low-end production capacity, and vigorously developed water-efficient and high-value-added electronic information industries. During this period, the closure of a large number of high-water-consumption and low-value-added industries led to a significant reduction in water consumption per 10,000 yuan of GDP and water consumption per 10,000 yuan of industrial value added in the province. However, there is still considerable room for further reducing water consumption per 10,000 yuan of GDP and water consumption per 10,000 yuan of industrial value added in industrially weak cities and counties, such as Xiangxi Prefecture, compared with the national average. The changes described above are visually reflected in the evolution trend of the CCD in Hunan Province. Except for Xiangxi Prefecture, the CCD of other cities exhibited varying degrees of increase after surpassing 0.6 in 2015.
In 2018, there was a significant decline in the CCD of most cities, with several even falling below 0.6. However, the CCD of all cities showed a remarkable upward trend in 2019–2020. In 2020, a total of six cities achieved a CCD above 0.8, with Changde City reaching a state of “excellent coordinative coupling”.
Spatial evolution characteristics of coupling coordinative degree
According to Fig. 9, the area in the province exhibiting a “barely coupled and declining” level of coordination decreased in 2005–2006. However, during 2005–2009, most cities in Hunan Province still experienced a state of coupling imbalance and decline, indicating an overall lack of optimistic coordination. During 2010–2013, there was some improvement in the CCD in certain areas. However, the overall coordination and development status in the province remained unstable, with many regions oscillating between the states of coupling imbalance and coordinated coupling.
Figure 9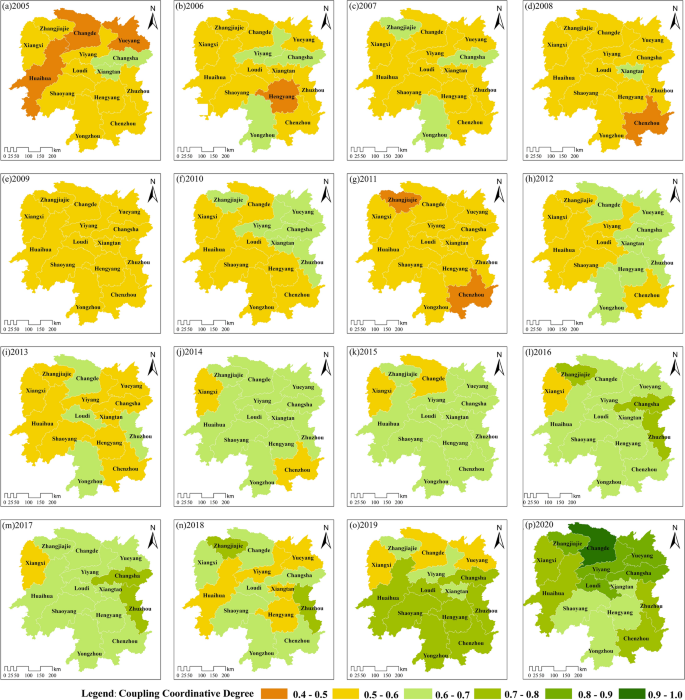
Geographical distribution of the CCD in Hunan Province from 2005 to 2020. Graphed by ArcGIS 10.2 and Adobe Illustrator 2021.
From 2016 to 2019, the overall CCD in the province exhibited a trend of an “initial increase followed by a decline.” In 2019, there was a significant difference in the coordinated development between the northern and southern parts of Hunan Province. Most of the northern regions were classified as “barely imbalanced and declining” or “initial and intermediate coupling coordination”, while the southern regions were predominantly in the “intermediate coordinated coupling” level. The level of coordinated development in the northern regions was noticeably lower than that in the southern regions. Until 2020, the coordinated development had a leap across the province, with all cities achieving a state of coordinated coupling.
In order to visually illustrate the spatial dispersion of the CCD, this study additionally employed the standard deviation ellipse method39,40 to analyze the geographical shift41 in the centroid of the CCD from 2005 to 2020. The results are presented in Fig. 10. The figure reveals that the spatial pattern of the standard deviation ellipse in Hunan Province generally follows a northwest-to-southeast direction. Cities such as Yiyang and Loudi, located within the boundaries of the standard deviation ellipse, are the main areas exhibiting coordinated distribution in Hunan province. In 2020, both the length of the major and minor axes had increased compared with 2005, indicating a slight expansion of the ellipse in both the east–west and north–south directions. Additionally, there was a significant increase in the area of the ellipse in 2020 compared with that in 2005, suggesting a larger relative coverage of the ellipse and an increased disparity in the level of coupling and coordination among different cities within the region.
Figure 10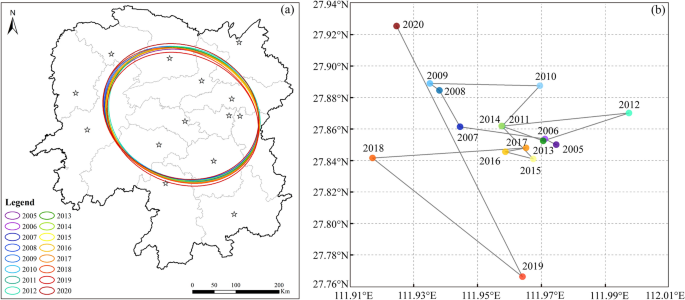
Interannual variation of the standard deviation ellipse in Hunan Province from 2005 to 2020. Graphed by ArcGIS 10.2, Adobe Illustrator 2021 and Origin 2021.
During 2005–2006, the centroid of the ellipse was located near 27.85N, 111.97E. From 2007 to 2009, the centroid gradually shifted towards the northwest. During 2010–2013, the centroid shifted in the direction of “southeast–southwest–northeast–southwest”. Between 2013 and 2017, the centroid was mainly concentrated within the range of 27.84N–27.86N and 111.95E–111.97E. From 2018 to 2020, the centroid shifted in the direction of “southwest–southeast–northwest,” with a noticeable increase in both the magnitude and trend of movement. In general, the centroid of the coordination phenomenon during 2005–2020 deviated to some extent from the geometric center of the province toward the northeast of Hunan Province. This indicates that the northern region of Hunan Province exhibits a higher level of coordination between water resources and economic-social development compared with the southern region.
Analysis of harmonious development capacity and development lag types
Regarding the trend of harmonious development capacity in Hunan Province between 2005 and 2020 (Fig. 11), the position of the harmony degree (H)gradually transitioned from the region bounded by the curves \(y={x}^{3}\) and \(y=x\) to the region bounded by the curves \(y={x}^{3}\) and \(y={x}^{1/3}\), during which it approached the dashed line \(y=x\) before gradually diverging, indicating an overall upward trend followed by a decline in harmonious development capacity in Hunan Province from 2005 to 2020. Conversely, the development degree (D) in Hunan Province gradually approached the solid line \(y=1-{x}^{3}\), indicating a progressive increase in the harmonious development capacity during this period.
Figure 11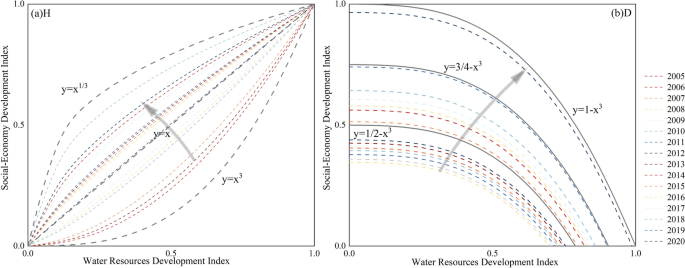
Multi-year changes in the harmonious development capacity in Hunan Province from 2005 to 2020.
Table 4 presents the calculated results of harmonious development capacity and development lag types for each city in Hunan Province from 2005 to 2020. During 2005–2008, except for Changde and Zhangjiajie cities, which were classified as Type III in terms of developmental lag, the remaining 13 cities in Hunan Province were categorized as Type IV or V. This indicated a significant decline in the development index of WRS in most regions during this stage, reflecting an overall pronounced water resource development lag.
Table 4 Harmony development capacity and development lag types in Hunan Province from 2005 to 2020.
From 2009 to 2016, the development lag types in cities such as Changsha, Zhuzhou, Zhangjiajie, Chenzhou, Yongzhou, and Loudi shifted from water lag to economic lag. Specifically, Changsha City experienced a decrease in HD level, indicating a highly uncoordinated situation between WRS and SES. The HD levels among the other five cities showed an increase, indicating the significant acceleration of WRS development, far outpacing SES development. This suggested a more efficient state of water resource utilization and development to a certain extent. On the other hand, cities such as Xiangtan, Hengyang, Yueyang, and Huaihua transitioned to a relatively weak water lag during this stage, with an overall increasing trend in HD levels. This indicated a certain degree of alleviation of the contradiction between social-economy development and water resource scarcity. However, the economic growth rate outpaced the rate of improvement in water poverty conditions, emphasizing that water resource scarcity remains a significant obstacle that cannot be ignored.
From 2017 to 2020, eight cities including Changsha, Yueyang, Changde, Zhangjiajie, Yiyang, Huaihua, Loudi, and Xiangxi, experienced a WRS development rate that far exceeded the pace of SES, indicating a pronounced economic lag. Furthermore, Chenzhou and Yongzhou cities saw an increase in their economic development rates, which surpassed the concurrent rate of water resource development, indicating a relatively weak water resource development lag. In the situation where the cities of Yueyang, Xiangxi, and Hengyang experienced a lack of synchrony between water resources and the rate of social-economy development, there was a pronounced decrease in HD level, necessitating a particular emphasis on enhanced control.
Comments are closed.